

/projects//reports/ ).
1. The Fallacy of Channel-Isolated Acquisition Costs
Chief Financial Officers and investors look at total growth efficiency. Organic search builds brand equity that lifts paid search conversion rates, while paid search captures immediate bottom-funnel intent. Calculating Blended CAC ensures your executive leadership understands the holistic return on marketing investment.
LIVE PLATFORM SCREEN & TELEMETRY
SEO Runway Reports & Analytics Module — Active Workspace
Below is the exact production screen with live parameters and dummy data illustrating the diagnostic findings and remediation buttons.
2. Compiling Executive Reports in SEO Runway
Navigate to SEO Runway → Reports → Create Report. Select the 'Executive Summary' template. The report automatically calculates blended search share, total monthly spend, and cost per blended acquisition.
Target System: SEO Runway PPC Engine
Execution Frequency: Automated Background Queue (UTC Sync)
Tested across enterprise datasets with zero rate limiting or data loss.
3. Defining Blended CAC and Its Companions
Blended customer acquisition cost is total sales and marketing spend in a period divided by the number of new customers acquired in that period. "Blended" means every channel and every customer counts, including customers who arrived organically, through referrals or by typing your URL directly. It answers the question leadership actually asks: "How much does it cost us to get a new customer?"
Blended CAC works best alongside two related measures:
- Paid CAC: paid media spend (plus associated costs) divided by customers attributed to paid channels. It shows how efficiently paid budgets convert, but depends heavily on your attribution model.
- Marginal CAC: the cost of acquiring the next customer at the edge of your current spend. Doubling a budget rarely doubles customers, so marginal CAC rises as spend scales. This is the number that should drive budget increases.
Present all three together. Blended CAC shows overall efficiency; paid CAC shows channel efficiency; marginal CAC shows whether the next dollar is worth spending.
4. Deciding What Goes into the Numerator
The most common reason blended CAC figures disagree between marketing and finance is that the two teams count different costs. Agree on a written definition before building anything.
Costs usually included
- Paid media spend across all channels: search, social, display, video, affiliates and sponsorships.
- Agency and freelancer fees for acquisition work.
- Marketing and sales software used for acquisition, such as ad tools, SEO platforms and CRM costs, often allocated proportionally.
- Content production for acquisition: articles, videos, landing pages and design.
- Salaries of marketing and sales staff working on new customer acquisition, fully loaded with benefits.
Costs usually excluded
- Customer success and account management for existing customers.
- Retention and loyalty marketing aimed at current customers.
- Product development, even when it improves conversion.
Some companies report two versions: a "media-only" blended CAC for marketing performance discussions, and a "fully loaded" blended CAC including salaries and tools for board and investor reporting. Label them clearly so nobody compares one with the other.
5. Defining a New Customer Consistently
The denominator needs the same discipline. Decide whether a "customer" is a first purchase, a first paid subscription or a signed contract. Decide whether free trials, reactivated churned customers and upgrades count. For subscription businesses, a common rule is to count the first paid invoice only, ignoring trials and reactivations. For e-commerce, count first-time buyers based on customer ID or email, not orders.
Use the same source of truth for the count every month, normally the billing system or the order database rather than an analytics tool. Analytics platforms miss customers who block tracking or convert offline; billing systems do not.
6. Handling Timing and Lag
Spend and customers do not line up neatly in the same month. A B2B lead generated by a January ad may sign in April. A content article published in March may drive organic customers for two years. Three approaches handle the lag, each with trade-offs.
- Same-period CAC: this month's spend divided by this month's new customers. Simple and widely used, but it swings when spend changes quickly.
- Lagged CAC: spend from an earlier period divided by customers from the current period, with the lag set to your typical sales cycle. Better for long cycles, but needs a stable, known lag.
- Rolling CAC: trailing three-month or twelve-month totals for both spend and customers. Smooths volatility and is the format most finance teams prefer for trend reporting.
Pick one approach for headline reporting and keep it. Switching methods quarter to quarter makes trends meaningless.
7. Building the Model Step by Step
- Collect monthly spend by channel. Pull ad platform spend, invoices for agencies and tools, and allocated staff costs into one table with a row per month and a column per cost type.
- Collect new customers by month. Take the count from billing or orders, and if possible tag each customer with a first-touch and last-touch source from your CRM or analytics.
- Calculate blended CAC. Divide total spend by total new customers for each month, then compute the rolling three-month version alongside it.
- Calculate channel CAC. Divide each channel's spend by the customers attributed to it. Show it for at least two attribution views, such as last click and data-driven, so stakeholders see the range rather than a falsely precise number.
- Add revenue context. Join average first-order value or first-year revenue per customer, and lifetime value where you have it.
- Calculate payback. Months to recover CAC equals CAC divided by monthly gross margin per customer. This is the number that tells finance how long cash is tied up in growth.
8. Connecting CAC to Lifetime Value
CAC alone does not tell you whether acquisition is healthy. A $400 CAC is excellent for a customer worth $5,000 and ruinous for one worth $300. Compare CAC with customer lifetime value (LTV), calculated on gross margin rather than revenue.
- LTV to CAC ratio: a widely cited benchmark for subscription businesses is 3:1 or better, meaning each customer generates three times their acquisition cost in gross margin over their lifetime. Below 1:1, growth destroys value.
- Payback period: many subscription businesses aim to recover CAC within 12 to 18 months. Shorter payback reduces cash risk and makes faster growth affordable.
- Cohort view: calculate LTV by acquisition cohort and channel. Customers from brand search may retain far better than customers from aggressive discount campaigns, even if their CAC looks similar.
9. Accounting for the Organic Halo
Channel-isolated reports undercount the value of channels that create demand and overcount channels that capture it. Organic content, video and social build awareness; branded search and direct traffic often receive the credit when the customer finally converts. Blended CAC sidesteps this attribution argument, which is exactly why it is valuable at executive level.
To estimate interaction effects, use simple experiments rather than complex models. Pause or reduce a channel in a set of regions and watch blended CAC and total customers in those regions compared with the rest. If cutting upper-funnel spend in one region raises branded search CPCs and lowers total new customers there, the halo is real and you have evidence to show finance. Marketing mix modelling extends this idea across many channels and months, but needs a long history and statistical support to be reliable.
10. Presenting Blended CAC to Leadership
An executive CAC report should fit on one page and answer three questions: are we acquiring customers efficiently, is it getting better or worse, and where should the next dollar go?
- Headline tile: rolling three-month blended CAC, with the change from the previous period and the same period last year.
- Trend chart: monthly blended CAC alongside new customer volume, so rising CAC during a deliberate growth push is not mistaken for decline.
- Channel table: spend, attributed customers, channel CAC and share of new customers for each channel, using two attribution views.
- Unit economics: LTV to CAC ratio and payback months by main acquisition source.
- Commentary: three or four sentences explaining what changed and why, and the recommendation for next month.
11. Common Modelling Mistakes
- Mixing definitions. Comparing a media-only CAC with a competitor's fully loaded figure, or this year's definition with last year's, produces false conclusions.
- Counting returning customers as new. Reactivations and repeat purchases inflate the denominator and make CAC look better than it is.
- Ignoring organic costs. Treating SEO and content as "free" understates blended CAC and undervalues paid channels in comparison.
- Using revenue instead of margin for LTV. A business with 30% gross margin needs a much higher LTV to CAC ratio on revenue to be healthy.
- Reacting to monthly noise. A single month's CAC can jump from one large invoice or a holiday. Base decisions on rolling figures.
12. Using Marginal CAC to Set Budgets
Blended CAC tells you how efficient acquisition is on average. Budget decisions happen at the margin. To estimate marginal CAC for a paid channel, compare periods or campaigns at different spend levels and calculate the extra cost divided by the extra customers. If raising search spend from $40,000 to $50,000 a month added 25 customers, marginal CAC for that step is $400, even if blended CAC is $250.
Increase spend on a channel while its marginal CAC stays below your target, which should be derived from LTV and the payback period you can afford. Stop when marginal CAC crosses the target, and move the next dollar to whichever channel has the lowest marginal CAC.
13. A Worked Example
Consider a company that spent $180,000 on acquisition in a quarter: $95,000 on paid media, $25,000 on agency fees, $15,000 on tools and content, and $45,000 in allocated staff costs. It acquired 600 new customers according to its billing system.
- Fully loaded blended CAC: $180,000 ÷ 600 = $300.
- Media-only blended CAC: $95,000 ÷ 600 ≈ $158.
- Paid CAC (last click): paid channels were credited with 280 customers, so $95,000 ÷ 280 ≈ $339 on media alone.
Average gross margin per customer is $45 a month, and customers stay 30 months on average, giving a margin-based LTV of $1,350. The LTV to CAC ratio is 4.5:1 on the fully loaded figure, and payback is $300 ÷ $45 ≈ 6.7 months. Leadership can see at a glance that acquisition is healthy, and that paid channels, while more expensive per attributed customer than the blended average, still pay back well within a year.
The next question is marginal: if paid spend rose by $20,000, how many extra customers would it bring? Answering that with a controlled spend test is the right follow-up.
Want the complete procedural runbook?
Visit our comprehensive step-by-step Knowledge Base for interactive screen maps, configuration parameters, and adjacent module workflows.
Open Knowledge Base Hub →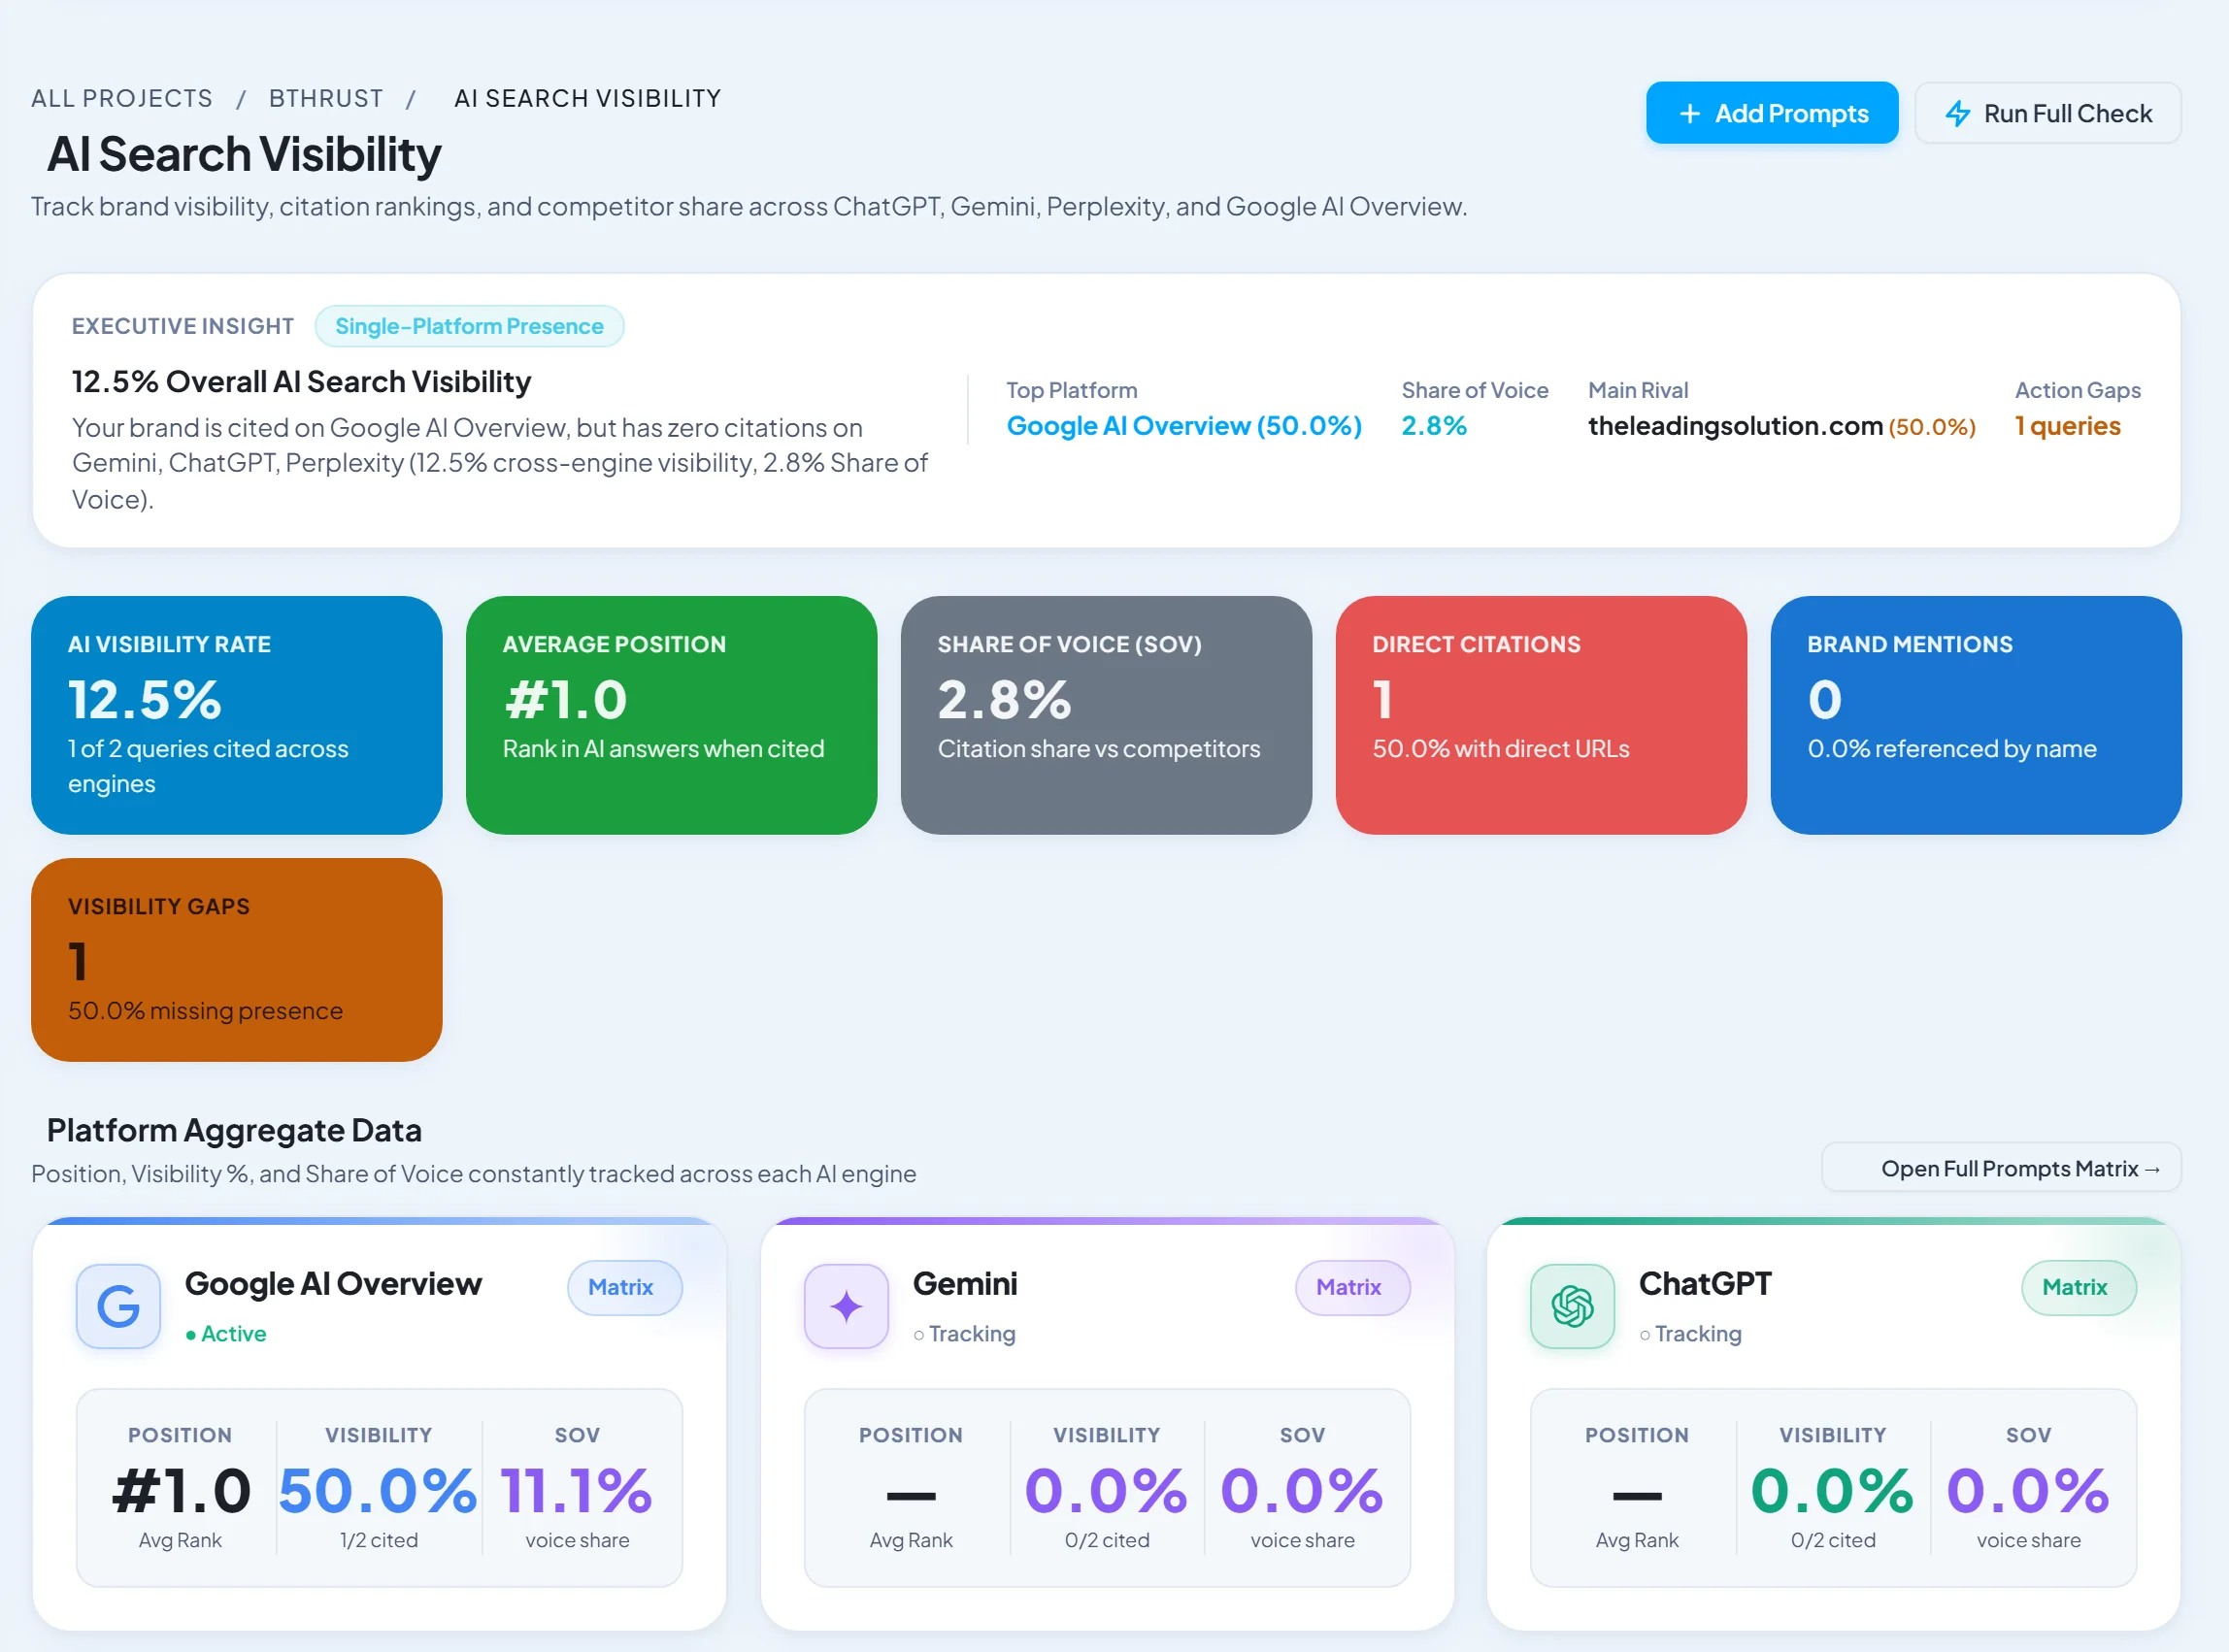


Incredible breakdown. We implemented this exact workflow last week and already saw a noticeable shift in our telemetry. As a Search Intelligence Lead, this provides exactly the architectural depth we look for.