

/projects//social/ ).
1. Moving Beyond Follower Vanity Metrics
A competitor with 50,000 followers who generates 5 likes per post is effectively dead in the algorithm. An agile challenger with 5,000 followers who averages 80 comments per post commands true community influence. Measuring engagement ratios exposes real market strength.
LIVE PLATFORM SCREEN & TELEMETRY
SEO Runway Social Media Overview & Competitor Intelligence — Active Workspace
Below is the exact production screen with live parameters and dummy data illustrating the diagnostic findings and remediation buttons.
2. Benchmarking in SEO Runway
In SEO Runway → Social Media, review competitor publishing cadences to identify content gaps where your brand can establish undisputed thought leadership.
Target System: SEO Runway SOCIAL Engine
Execution Frequency: Automated Background Queue (UTC Sync)
Tested across enterprise datasets with zero rate limiting or data loss.
3. What Share of Voice Means on Social Media
Share of voice measures how much of the conversation in your market belongs to your brand compared with competitors. On social media, it can be calculated in several ways: the share of mentions, the share of engagement or the share of reach in your category. Unlike follower counts, which grow slowly and can be inflated, share of voice shows how visible and talked-about you are right now, relative to the competition.
A competitor engagement audit combines share of voice with a closer look at what competitors post, how their audiences respond and where opportunities exist. The goal is not to copy competitors, but to understand the landscape well enough to make better decisions about your own content.
4. Choosing Competitors and Platforms
- Direct competitors: three to five companies selling similar products to the same customers.
- Aspirational competitors: one or two brands, possibly in adjacent markets, whose social presence you admire.
- Platforms: focus on the networks that matter most for your audience, such as LinkedIn for B2B, and Instagram and Facebook for consumer brands.
- Time period: analyse at least the last 90 days, to capture patterns rather than one-off spikes.
Document the list and keep it consistent across audits, so you can compare results over time.
5. Metrics That Matter More Than Followers
- Posting frequency: how often each competitor posts on each platform.
- Engagement per post: average reactions, comments and shares per post.
- Engagement rate: engagement per post divided by follower count, which allows fair comparison between large and small accounts.
- Comment quality: whether comments are real conversations or just emojis and tags.
- Share of engagement: each brand's total engagement as a percentage of the combined engagement of all brands in the audit.
- Mentions and share of voice: how often each brand is mentioned by others, using social listening tools where available.
- Follower growth rate: percentage growth over the period, more meaningful than total followers.
- Format mix: the share of videos, carousels, images, text posts and links.
6. Collecting the Data
- Manual collection: for a small audit, review each competitor's last 30 to 50 posts per platform and record date, format, topic and engagement in a spreadsheet.
- Native tools: some platforms offer limited competitor benchmarking, such as LinkedIn's competitor analytics for company pages, which compares follower growth and engagement with chosen competitors.
- Social listening and analytics tools: paid tools can track mentions, engagement and share of voice automatically across many accounts and platforms.
- Consistency: collect the same metrics for every competitor and for your own accounts, over the same period.
Manual audits take a few hours but give a much deeper understanding of competitors' content than automated dashboards alone.
7. Analysing Content Themes
Numbers show who is winning; content analysis shows why.
- Tag each post by theme: education, product, customer stories, culture, industry news, promotions, events.
- Calculate average engagement by theme for each competitor and for your brand.
- Identify top posts: the five best-performing posts for each competitor, with notes on what made them work, such as a strong hook, a surprising statistic, a human story or an original visual.
- Look for gaps: themes your audience clearly values that no competitor covers well.
- Look for saturation: themes everyone covers in the same way, where standing out requires a different angle.
8. Analysing Formats and Timing
- Format performance: compare engagement for videos, carousels, images and text posts across competitors. If carousels consistently outperform on LinkedIn for every brand, that is a strong signal.
- Video length and style: short, fast-paced clips versus longer explainers.
- Posting times: when competitors post and whether their timing correlates with engagement.
- Frequency versus engagement: whether competitors who post more also get more total engagement, or whether quality beats quantity.
9. Analysing Community and Responsiveness
- Reply rate: how often competitors reply to comments on their posts.
- Response time to questions and complaints.
- Tone: formal, friendly, humorous or technical.
- Sentiment: whether comments and mentions are mostly positive, neutral or negative.
- Customer service on social: whether competitors handle support publicly, and how well.
Weak responsiveness from competitors is an opportunity: a brand that consistently engages with its audience can stand out quickly.
10. Turning the Audit into Action
Summarise the audit in a short report with clear recommendations.
- Benchmark table: your brand and each competitor, with frequency, engagement rate, share of engagement, follower growth and share of voice.
- Key findings: three to five insights, such as "Competitor B's customer stories get three times their average engagement" or "No competitor posts educational carousels on LinkedIn".
- Opportunities: content themes, formats or community practices to adopt or improve.
- Threats: competitors gaining momentum, new entrants or shifts in audience attention.
- Actions: specific changes for the next quarter, each with an owner and a measure of success.
11. Common Mistakes
- Comparing follower counts instead of engagement rates and growth.
- Copying competitors' content rather than learning from it.
- Auditing too short a period, so one viral post skews results.
- Ignoring your own accounts in the comparison.
- Treating engagement as the goal, without linking it to traffic, leads or sales.
- Running the audit once and never repeating it.
12. A Worked Example
A B2B cybersecurity company felt it was losing attention on LinkedIn to two larger competitors. A 90-day audit showed that, while the competitors had more followers, their engagement rates were similar to the company's own. The difference was format and theme: one competitor's educational carousels on common security mistakes consistently outperformed everything else in the category, and neither competitor posted content from its engineers. The company launched a series of carousels based on its incident response experience and began featuring its security researchers in short videos. Over the next quarter, its share of engagement in the competitor set grew significantly, and its follower growth rate overtook both competitors.
13. How Often to Audit
- Quarterly: a full audit with benchmarks, themes, formats and community analysis.
- Monthly: a quick check of share of engagement and competitors' top posts.
- Ad hoc: when a competitor launches a major campaign, rebrands or enters a new market.
Keep previous audits so you can track trends: whether your share of voice is growing, which competitors are gaining momentum and whether your changes are working.
14. Competitor Audit Checklist
- Choose three to five direct competitors and one or two aspirational brands.
- Focus on the platforms that matter most and analyse at least 90 days.
- Collect frequency, engagement rate, share of engagement, growth and mentions.
- Tag posts by theme and format and compare performance.
- Assess responsiveness, tone and sentiment.
- Identify gaps, saturated themes and opportunities.
- Report findings with specific actions, owners and measures.
- Repeat quarterly and track trends.
15. Connecting Share of Voice to Business Results
Social share of voice becomes more persuasive when linked to outcomes leadership cares about. Track it alongside branded search volume, website traffic from social, leads attributed to social and, where available, market share data. Many marketers observe that brands growing their share of voice faster than their market share tend to gain market share over time. Whether or not that pattern holds precisely in your market, showing share of voice trends next to traffic and leads makes social performance much easier for leadership to understand.
16. Your Next Step
Pick your two closest competitors and your most important platform. Record their last 30 posts and your own, with format, theme and engagement, in a simple spreadsheet. Calculate engagement rate and share of engagement for each brand. An afternoon's work will show you which themes and formats your audience values most, and where your competitors are leaving room for you to stand out. Share the findings with your team and agree on one change to test over the next month, then measure whether your share of engagement moves.
17. Auditing Paid Social Alongside Organic
Organic posts are only part of competitors' social presence. Many also run paid campaigns, which shape what audiences see.
- Ad libraries: Meta's Ad Library shows active ads running on Facebook and Instagram for any advertiser, and LinkedIn provides an ads tab on company pages showing ads they have run. Review competitors' current ads, offers and creative.
- Messaging: note the value propositions, offers and calls to action competitors use in ads, which often reveal what they believe converts best.
- Creative formats: videos, carousels, lead forms or single images.
- Volume and duration: ads that have run for months are likely performing well enough to keep.
- Landing pages: follow ad links to see the offers and funnels behind them.
Combining organic and paid insights gives a fuller picture of each competitor's strategy. A competitor with modest organic engagement may still dominate attention through consistent paid campaigns.
18. Using AI to Speed Up Analysis
AI tools can help categorise large numbers of competitor posts by theme, summarise common messages and identify patterns in top-performing content. Export post text and engagement data, ask the AI to tag themes and summarise what distinguishes the best posts, then check its conclusions against the data. AI accelerates the analysis, but the strategic judgement about what to do next should stay with your team.
19. Presenting the Audit to Leadership
Keep the leadership version short: one benchmark chart showing share of engagement by brand over time, three key insights and three recommended actions with expected outcomes. Leaders rarely need post-level detail; they need to know where the brand stands, why, and what the team will do about it next quarter. Keep the detailed spreadsheet available for anyone who wants to dig deeper, and repeat the same chart every quarter so progress is easy to see at a glance. Consistent reporting builds confidence in the numbers over time.
Want the complete procedural runbook?
Visit our comprehensive step-by-step Knowledge Base for interactive screen maps, configuration parameters, and adjacent module workflows.
Open Knowledge Base Hub →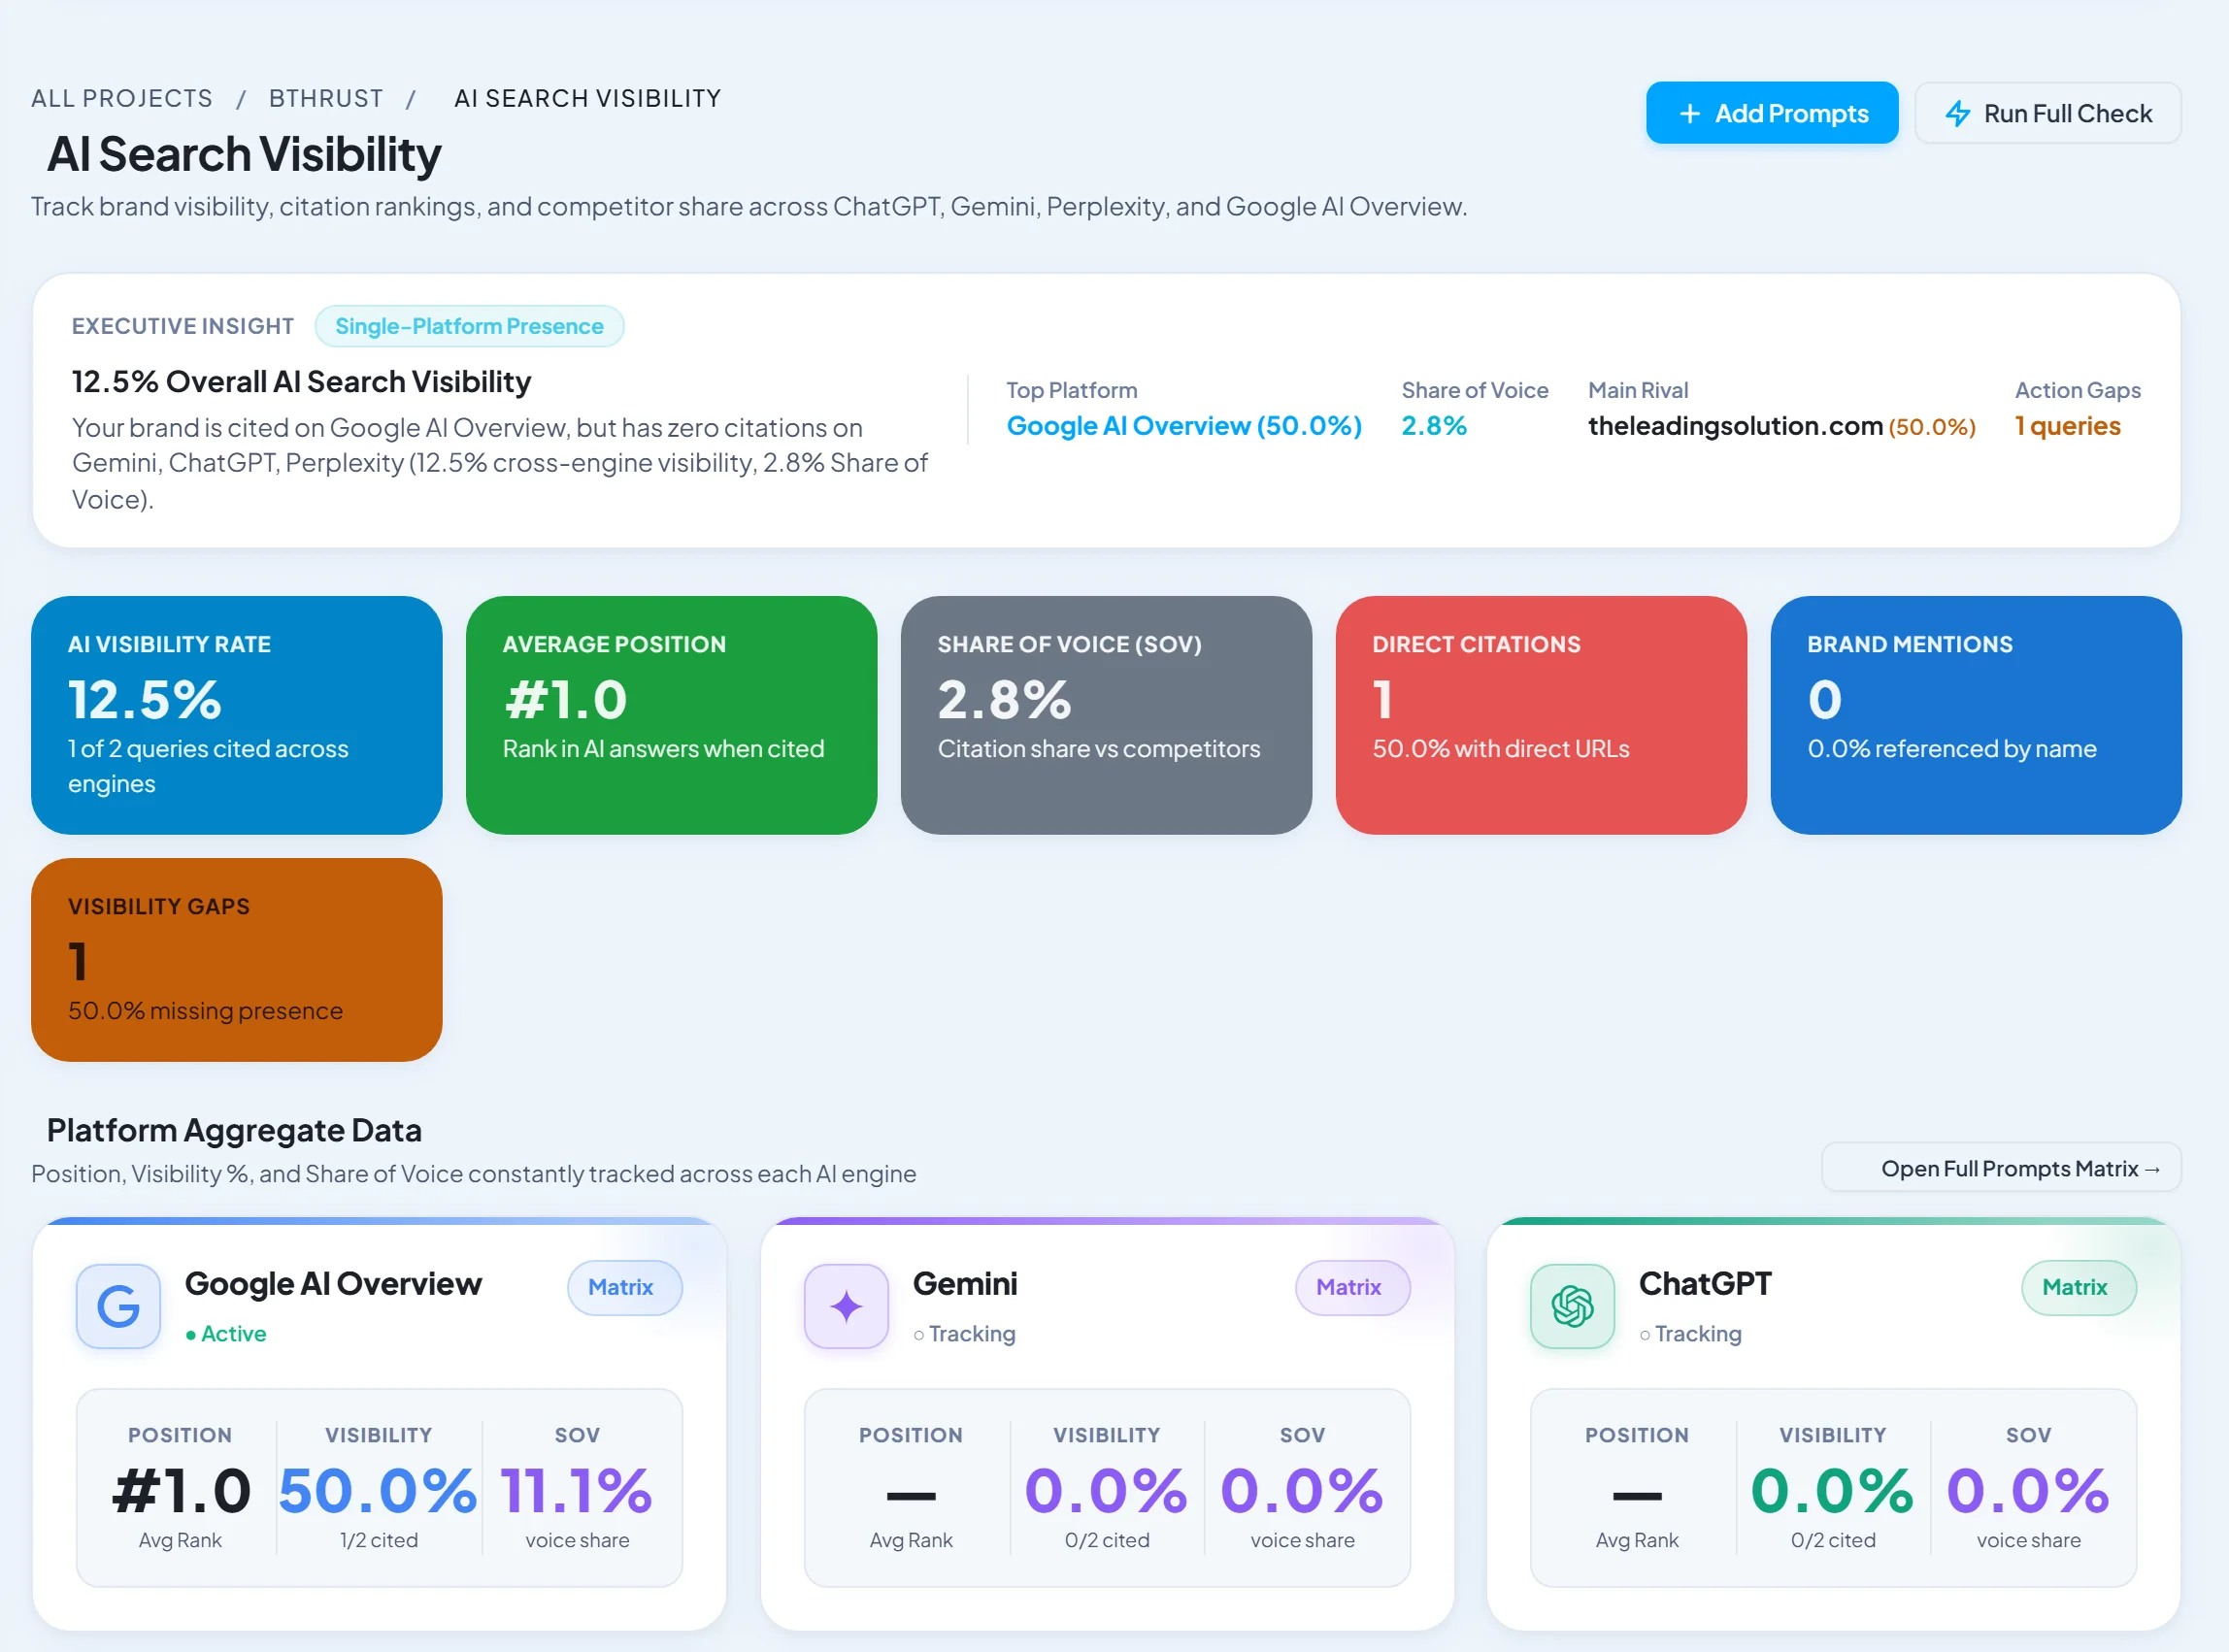


This is one of the clearest architectural explanations of this topic on the web. Sharing this directly with our senior delivery team. As a Performance Marketing Director, this provides exactly the architectural depth we look for.