
/projects//keywords/ & /projects//analytics/ ).
1. The Hidden Social-to-Search Conversion Pathway
Most analytics models fail to attribute search traffic to social media because users don't click the link in the post. They see the content, discuss it with colleagues, and hours later search Google for your product. Tracking branded keyword impression velocity reveals the true impact of social reach.
LIVE PLATFORM SCREEN & TELEMETRY
SEO Runway Keywords Rank Tracker & Analytics Dashboard — Active Workspace
Below is the exact production screen with live parameters and dummy data illustrating the diagnostic findings and remediation buttons.
2. Correlating Data in SEO Runway
In SEO Runway → Keywords, inspect the 30-day trendline for your branded keyword cluster. Overlay your social publishing dates from Social Calendar to verify clear correlation peaks.
Target System: SEO Runway SOCIAL Engine
Execution Frequency: Automated Background Queue (UTC Sync)
Tested across enterprise datasets with zero rate limiting or data loss.
3. How Social Campaigns Influence Search
When a social campaign takes off, the effects spread beyond the platform. People who see a post often do not click it. Instead, they remember the brand, product or idea and search for it later, sometimes days afterwards, sometimes on a different device. That behaviour creates a measurable rise in search activity: more searches for your brand name, more searches for the product or campaign terms, and more visits arriving through organic search.
Because these visits come through search, standard attribution usually credits organic search, not social. Social teams under-report their impact, and SEO teams see unexplained spikes. Measuring search lift helps both teams understand what really happened.
The forms search lift takes
- Branded search: more people searching the company or brand name.
- Branded plus product searches: "brand + product name" or "brand + campaign phrase".
- Topic searches: more searches for the subject of the campaign, even without the brand name.
- Navigational searches: people searching for the brand's website, app or social profile.
- Organic traffic: more visits from search to the homepage and campaign-related pages.
4. Setting a Baseline Before the Campaign
Search lift is only measurable against a clear baseline. Before a campaign launches, or retrospectively for a campaign that already happened, gather the normal levels of the metrics you will track.
- Search Console data: daily clicks and impressions for branded queries, campaign-related queries and the pages the campaign promotes, for at least eight weeks before the campaign.
- Google Trends: relative search interest for the brand name and campaign terms, which shows broader patterns including searches that do not lead to your site.
- Analytics: daily organic sessions to the homepage and campaign pages, plus direct traffic.
- Seasonality: the same period in the previous year, to account for normal seasonal swings.
- Other activity: a list of other marketing activity, press coverage and events in the period, which could also cause changes.
Define branded queries carefully. Include the brand name, common misspellings and product names, and exclude queries that contain the brand name but mean something else.
5. Measuring the Lift
Simple before-and-after comparison
Compare the campaign period, plus a few weeks afterwards to capture delayed searches, with the baseline period of equal length. Calculate the percentage change in branded impressions, branded clicks and organic sessions to campaign pages. This is quick and easy to explain, but it can be distorted by seasonality and other activity.
Year-on-year comparison
Compare the campaign period with the same period last year, adjusted for overall growth. If branded search normally grows 10% year on year and the campaign period grew 45%, the extra growth is a reasonable estimate of the campaign's effect.
Geographic comparison
If the campaign targeted specific regions, compare search activity in those regions with similar regions that were not targeted. Google Trends and Search Console's country breakdown support this kind of comparison. The difference between targeted and untargeted regions is a strong indicator of lift.
6. Correlating Social Activity with Search Data
Line up social performance and search data on the same timeline to see how closely they move together.
- Export daily social metrics: impressions, video views, engagement and shares for the campaign posts.
- Export daily search metrics: branded impressions and clicks from Search Console, plus organic sessions from analytics.
- Chart them together: plot social impressions and branded search impressions on the same chart, with dates aligned.
- Look for lagged patterns: search activity often peaks a day or two after the social peak, and decays more slowly.
- Check for confounding events: press coverage, email campaigns, paid advertising and product launches in the same period.
A strong, consistent relationship, where search rises shortly after each social spike and returns to baseline afterwards, is convincing evidence of social-driven search lift. It is not proof of causation on its own, but combined with a geographic or year-on-year comparison it builds a solid case.
7. Making the Path from Social to Search Easy
You can increase search lift by making it easy for people to find you after seeing a campaign.
- Use a memorable, searchable campaign name or phrase, and make sure your website ranks for it.
- Create a campaign landing page optimised for the campaign name and related terms.
- Keep the brand name visible in campaign videos and images, not only in the account handle.
- Prepare for branded demand: make sure branded search results show accurate titles, descriptions and sitelinks, and consider a brand search ad during major campaigns to protect against competitors.
- Update your profiles: Business Profile, social profiles and website messaging should all reflect the campaign while it runs.
8. Estimating the Value of Search Lift
Once you have estimated the extra branded searches and organic visits caused by a campaign, translate them into business value.
- Extra organic visits: the difference between campaign-period organic visits and the expected baseline.
- Conversion rate: the conversion rate of branded organic visitors, which is often higher than average.
- Extra conversions: extra visits multiplied by conversion rate.
- Value: extra conversions multiplied by average order value or lead value.
- Equivalent paid cost: what those visits would have cost through paid search, using average CPCs for the relevant terms.
Present the estimate with a range rather than a single figure, and explain the assumptions. Leadership is more likely to trust an honest range than an overly precise number.
9. Reporting Search Lift to Stakeholders
- A timeline chart showing social impressions and branded search on the same axis.
- Headline numbers: percentage lift in branded search impressions and clicks, extra organic sessions and estimated conversions.
- Comparison method: before-and-after, year-on-year or geographic, with the result of each where available.
- Context: other activities in the period that may have contributed.
- Lessons: what about the campaign appears to have driven search, such as a memorable phrase or a particular video.
Shared reporting between social and SEO teams avoids arguments over credit and focuses attention on what drove the result.
10. Common Measurement Mistakes
- Looking only at social platform metrics. Likes and views do not show the searches that followed.
- No baseline. Without normal levels, a rise cannot be attributed to anything.
- Ignoring seasonality. A December spike in branded search may be normal for retailers regardless of social activity.
- Too short a measurement window. Search lift often continues for days or weeks after the campaign peak.
- Attributing everything to social. Press coverage, email and paid activity in the same period also drive branded search.
- Loose branded query definitions, which include unrelated queries or miss misspellings.
11. A Worked Example
A consumer kitchenware brand ran a short-form video campaign that unexpectedly went viral on Instagram and Facebook, reaching millions of people over a week. The brand's analytics showed only a modest number of clicks from social. But Search Console revealed that branded search impressions roughly tripled in the week after the peak, and searches for "brand + product name" rose sharply. Comparing with the same period the previous year, and with countries where the video had not spread, the team estimated that most of the extra branded searches were driven by the campaign. Organic sales of the featured product rose accordingly. The social team now reports search lift alongside platform metrics for every major campaign.
12. Using Search Data to Improve Future Campaigns
Search data does not only measure campaigns; it improves them.
- Learn which messages people search for: queries that rise after a campaign show which words and ideas stuck in people's minds.
- Build pages around new demand: if a campaign creates searches for a phrase you do not rank for, create or improve a page that answers it.
- Find content ideas: questions that appear in search after a campaign often make good follow-up social content.
- Compare campaigns: track search lift for every major campaign, so you can see which formats and themes consistently drive search.
- Coordinate timing: plan SEO updates, landing pages and paid brand coverage around scheduled social campaigns.
13. Search Lift Measurement Checklist
- Define branded and campaign queries carefully.
- Collect at least eight weeks of baseline search and traffic data.
- Note other activities that could affect search in the period.
- Compare before and after, year on year and by region where possible.
- Chart social and search data on the same timeline and look for lagged patterns.
- Estimate extra visits, conversions and value with a range.
- Report jointly with SEO and social teams.
- Use rising queries to inform landing pages and follow-up content.
14. Your Next Step
Pick your most successful social campaign from the last six months. In Search Console, filter queries containing your brand name and compare daily impressions for the four weeks before, during and after the campaign. Chart the result next to the campaign's social impressions. Even this simple comparison often reveals a search effect that never appeared in social reports, and gives you a template for measuring the next campaign properly.
15. Tools Beyond Search Console
Search Console shows searches that led to impressions of your site, but not every search a campaign creates. Supplement it with other sources.
- Google Trends: relative interest for the brand and campaign terms, including searches where your site did not appear, with regional breakdowns.
- Paid search data: if you run brand search ads, impression volume for branded keywords rises with demand and gives another view of the lift.
- Site search: searches on your own website for campaign products or phrases.
- Social listening: mentions and conversations about the brand on social platforms, which often rise alongside search.
Using two or three sources together gives a more reliable picture than any one alone.
Want the complete procedural runbook?
Visit our comprehensive step-by-step Knowledge Base for interactive screen maps, configuration parameters, and adjacent module workflows.
Open Knowledge Base Hub →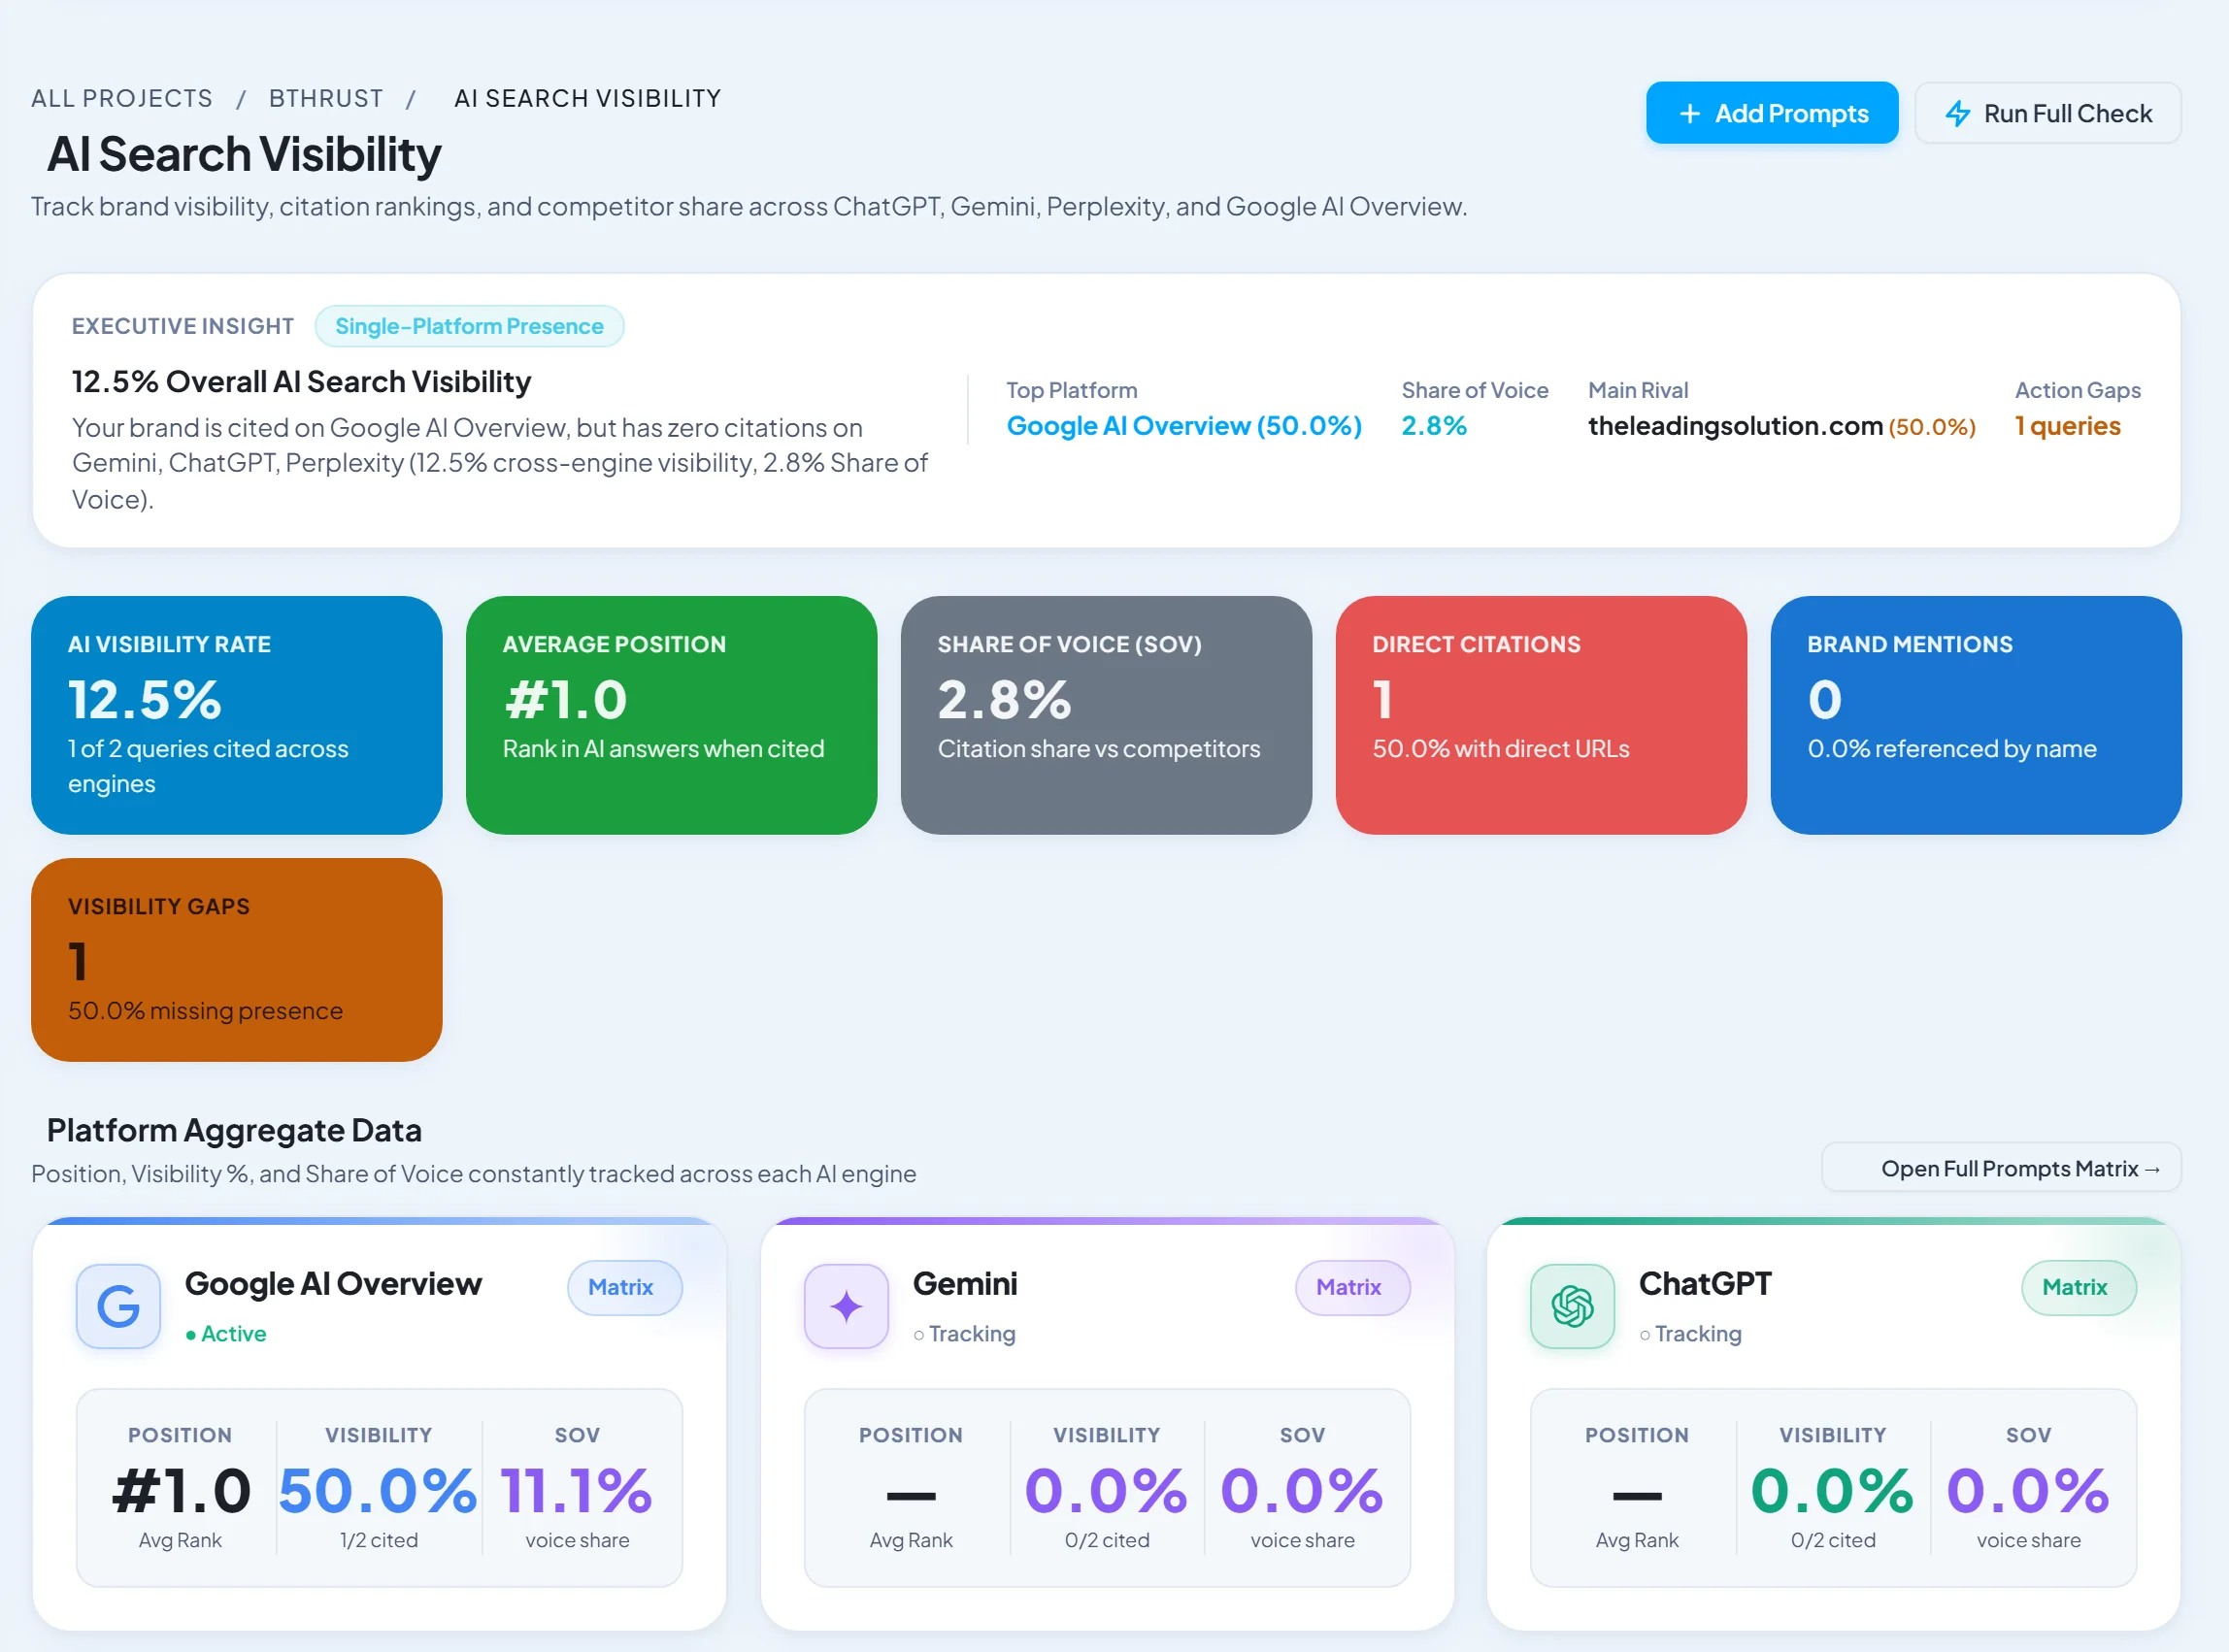


Incredible breakdown. We implemented this exact workflow last week and already saw a noticeable shift in our telemetry. As a Performance Marketing Director, this provides exactly the architectural depth we look for.