

/projects//local_seo/geo-grid/ ).
1. The Proximity Dilemma in Local Search
Google's local algorithm calculates relevance, prominence, and proximity. A business that ranks #1 directly in front of its front door may drop to rank #14 just 1.5 miles away due to competing businesses closer to the searcher's mobile device.
LIVE PLATFORM SCREEN & TELEMETRY
SEO Runway Local SEO Geo-Grid Rank Tracker — Active Workspace
Below is the exact production screen with live parameters and dummy data illustrating the diagnostic findings and remediation buttons.
2. Configuring Geo-Grid Scans in SEO Runway
- Open Screen (Local SEO → Geo-Grid Tracker):
- Select 'New Scan'. Enter your target commercial keyword (e.g., 'personal injury attorney near me').
- Select a 7x7 matrix (49 coordinate points) and set radius spacing (e.g. 1.0 km or 2.0 miles).
- Review the visual heatmap: Green (ranks 1-3), Yellow (ranks 4-10), Red (ranks 11+).
Target System: SEO Runway LOCAL Engine
Execution Frequency: Automated Background Queue (UTC Sync)
Tested across enterprise datasets with zero rate limiting or data loss.
3. Why a Single Rank Check Misleads Local Businesses
A traditional rank tracker reports one position for "emergency plumber" as if every searcher saw the same result. In local search that is never true. Google's local results depend heavily on where the searcher is standing, so a business can rank first for a searcher two streets away and fail to appear at all for someone three kilometres across town. A single check, usually taken from the city centre or the business's own address, hides this variation completely.
Geo-grid scanning fixes this by checking the same keyword from many points laid out in a regular grid around the business. Each point returns the business's map pack or local finder position at that exact location. Plotted on a map, the results show where you are strong, where you fade and where competitors take over. The resulting heatmap becomes the most honest picture of local visibility you can get without standing on every street corner with a phone.
What the grid reveals
- Your visibility radius: how far from your location you keep a top-three position before dropping off.
- Directional bias: strong rankings to the north and weak rankings to the east often reflect where competitors cluster, or where a river, motorway or city boundary changes Google's sense of the area.
- Competitor territory: zones where one rival consistently holds position one, telling you where they are strongest.
- Keyword differences: broad terms such as "dentist" usually have a much tighter radius than specific terms like "emergency dental implant", where fewer competitors exist.
4. Designing the Grid: Size, Spacing and Centre
A 7x7 grid contains 49 points. The spacing between points decides how much ground it covers, and choosing it well matters more than the grid size itself.
- Dense urban areas: use tight spacing, around 0.3 to 0.8 kilometres between points. In a city centre, rankings can change completely within a few blocks.
- Suburban areas: spacing of 1 to 2 kilometres usually captures the meaningful changes.
- Rural and service-area businesses: spacing of 3 to 8 kilometres may be needed to cover the area customers actually travel from.
Centre the grid on the business's verified location for a storefront. For a service-area business, centre it on the location Google holds for the profile, then run additional grids over the key towns in the service area. Match the overall coverage to your real customer catchment: a grid that spans 30 kilometres for a café produces a sea of "not ranking" points that tells you nothing useful.
Choosing keywords to scan
Pick between five and fifteen keywords per location, mixing the main category term ("plumber"), high-value service terms ("boiler repair", "drain unblocking"), and modifiers customers use ("24 hour plumber"). Avoid adding the city name to every keyword. Searchers on mobile rarely type it, and including it changes how Google interprets location intent. Track one or two city-name variants separately if they matter for your business.
5. Reading the Heatmap Metrics
Most geo-grid tools summarise a scan with a few headline numbers. Understand what each one tells you before reporting it.
- Average rank: the mean position across all grid points where you appear. Useful, but it can look good when you rank well in only a few points.
- Share of top-three points: the percentage of the 49 points where you appear in the map pack. This is the closest proxy for real map pack visibility.
- Points not ranking: how many locations return no position within the tracked depth, usually the top 20. A high number signals a narrow footprint.
- Share of local voice: some tools weight positions by expected click share across the grid, so first place counts far more than eighth.
Report the share of top-three points alongside average rank. A business that moves from 12 to 20 top-three points has made a real gain even if its average rank barely moved.
6. Separating Proximity from Prominence
Google has said local results are based on three main factors: relevance, distance and prominence. Distance is the one you cannot change for an existing location. Geo-grids help you see how much of your ranking pattern is pure proximity and how much you can influence.
Compare your grid with your strongest competitors' patterns. If every business in the category shows a tight circle around its own address, the market is proximity-dominated, and expanding your radius will take sustained work on prominence. If one competitor ranks well across the whole grid despite being located at the edge, they have built enough prominence, through reviews, links and relevance, to overcome distance. Study what they do differently.
Levers that extend your radius
- Category and relevance: the right primary category and service-specific content on your website make Google more confident you match the query.
- Reviews: a steady flow of genuine reviews that mention specific services and neighbourhoods strengthens prominence.
- Local links and mentions: coverage on local news sites, community organisations and suppliers signals you are an established part of the area.
- Location pages: genuinely useful pages for the main neighbourhoods you serve, with local details and real examples of work, help relevance in those areas.
- Behavioural signals: profiles with complete information, good photos and accurate hours tend to attract more engagement, which generally aligns with stronger visibility.
7. Running Scans Consistently
Geo-grid data is only useful if scans are comparable over time. Keep these variables fixed:
- Same grid centre, size and spacing for every scan of a given location and keyword.
- Same day and similar time, since results can shift slightly with business hours. A business that is closed may rank lower for some queries in the evening.
- Same device type. Most tools simulate mobile searches; do not switch between desktop and mobile without noting it.
- Same keyword list, so changes in average results reflect performance rather than a different mix of terms.
Scan monthly for routine monitoring and weekly during active optimisation or after significant changes, such as a category update or a move to a new address. Avoid scanning daily: day-to-day fluctuation in local results is normal and creates noise that tempts teams to react to nothing.
8. Turning Scans into an Action Plan
Each scan should end with a short list of decisions. A useful format pairs every weak zone with a hypothesis and an action.
- Weak zone to the east, dominated by one competitor: review that competitor's categories, reviews and location pages, then publish a page for the eastern neighbourhood with real project examples.
- Good rankings for "plumber" but poor for "boiler repair": add boiler repair as a service in the profile, strengthen the boiler repair page on the website and ask customers of those jobs for reviews.
- Visibility collapsed across the whole grid: check for a profile suspension, a category change, an address edit or a website outage before anything else.
9. Common Mistakes with Geo-Grid Tracking
- Oversized grids. Covering an area far beyond your real customer base makes performance look worse than it is and buries the useful signals.
- Treating every point equally. Points over a lake, an industrial estate or farmland matter less than points over dense residential streets. Weight your interpretation toward where customers live.
- Chasing perfect coverage. No business ranks first everywhere. Aim for strong visibility where your customers are, not a solid green map.
- Ignoring the organic results. Map pack rankings are only part of local visibility. Track your website's organic rankings for the same keywords too.
- Reporting heatmaps without context. Clients and managers need to know what changed, why and what happens next, not just a colourful image.
10. Reporting Geo-Grid Results to Clients and Owners
A good monthly local visibility report fits on one or two pages:
- The current heatmap for the two or three most valuable keywords, next to last month's.
- Share of top-three points and average rank for every tracked keyword, with the change from last month.
- The main competitor in each weak zone.
- Actions completed this month and actions planned for next month.
- Business results alongside visibility: calls, direction requests and website visits from the profile, and leads or bookings where available.
Connecting visibility to calls and bookings keeps the conversation focused on outcomes. A business that gains ground in its highest-value neighbourhoods should see it in enquiries within a few months.
11. Geo-Grid Scan Checklist
- Centre the grid on the verified location and match spacing to the area type.
- Track 5–15 keywords, mixing category, service and modifier terms.
- Keep grid settings, timing and device consistent between scans.
- Report share of top-three points as well as average rank.
- Compare your pattern with your top competitors to separate proximity from prominence.
- Pair each weak zone with a hypothesis and a concrete action.
- Rescan monthly, or weekly during active optimisation.
12. Start with One Keyword and One Location
If you have never run a geo-grid scan, start small. Pick your single most valuable keyword and your main location, run a 7x7 scan with spacing matched to your area, and run the same scan for your two strongest competitors. Those three heatmaps side by side will show more about your local market than months of single-point rank reports, and they give you a clear baseline to measure every future change against.
Want the complete procedural runbook?
Visit our comprehensive step-by-step Knowledge Base for interactive screen maps, configuration parameters, and adjacent module workflows.
Open Knowledge Base Hub →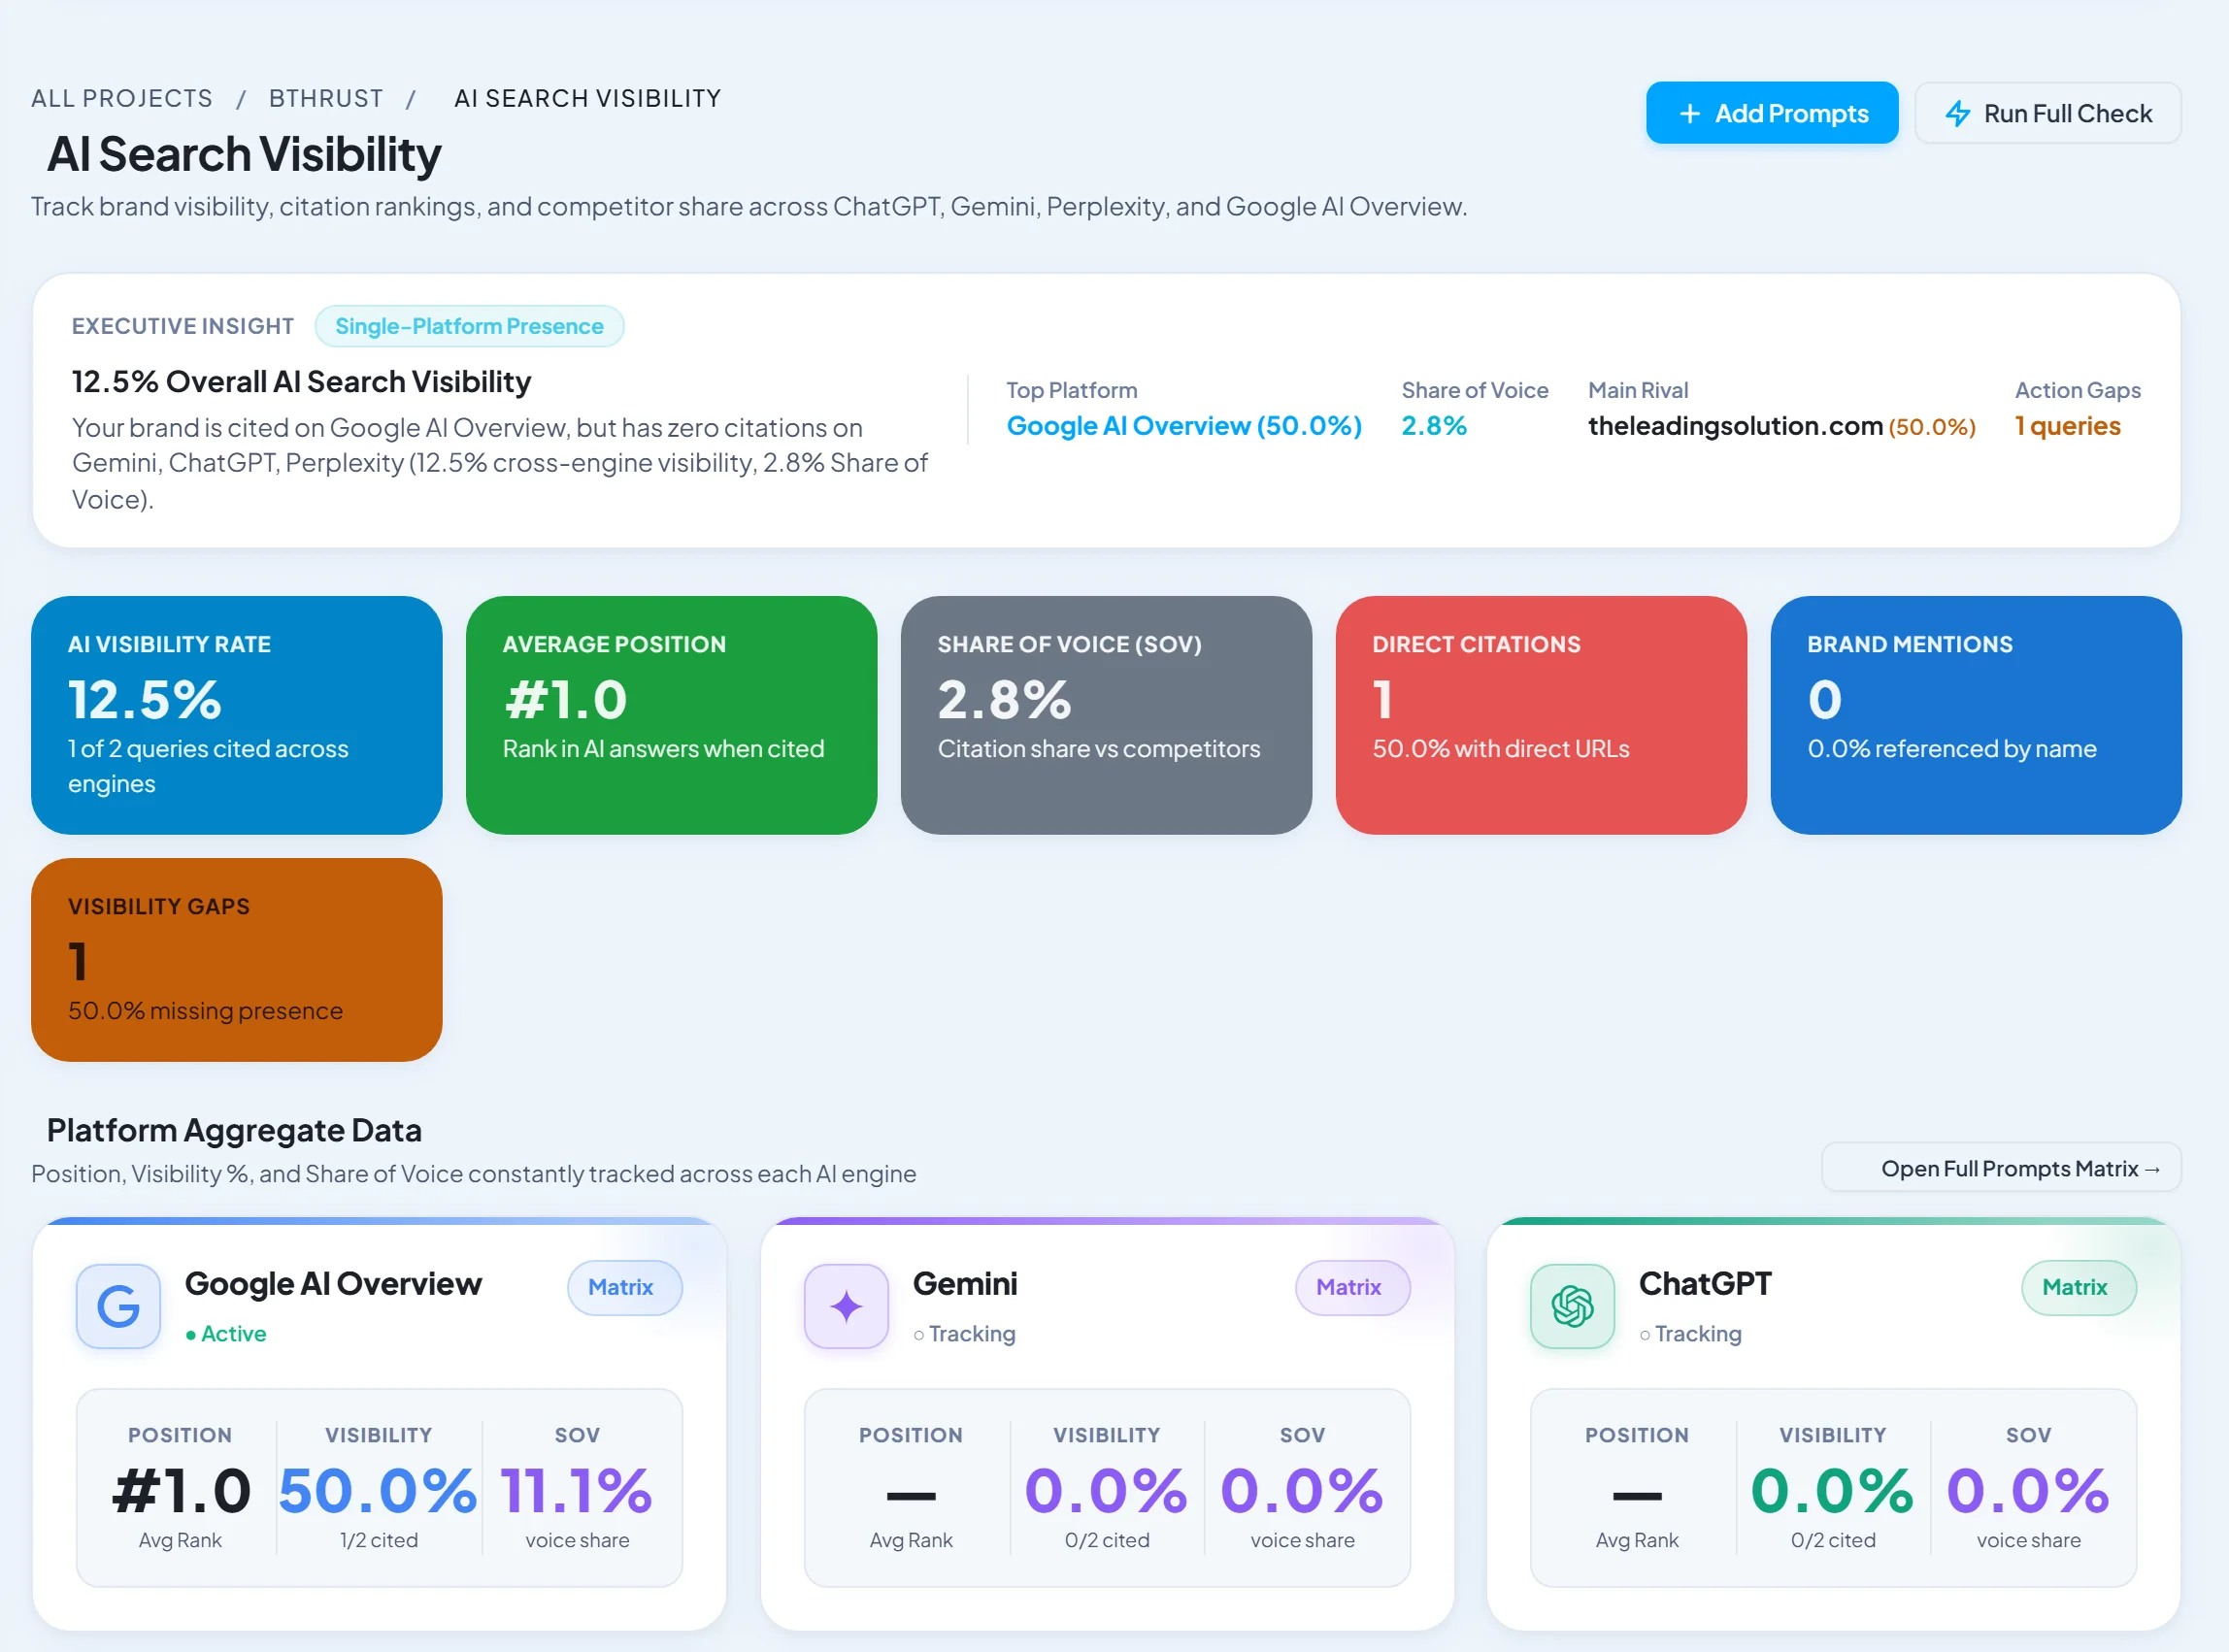


This is one of the clearest architectural explanations of this topic on the web. Sharing this directly with our senior delivery team. As a Agency Founder & Managing Director, this provides exactly the architectural depth we look for.