

/projects//reports/ ).
1. The Elements of a Churn-Proof Client Report
A winning client report follows a strict narrative: 1) Executive Summary (Total Revenue & Leads), 2) Top Organic Wins (Rankings & Traffic Value), 3) Paid Efficiency (CPA & ROAS), and 4) Action Items for the Upcoming Month. Raw data tables belong in the appendix.
LIVE PLATFORM SCREEN & TELEMETRY
SEO Runway Reports Builder & Automated Schedules — Active Workspace
Below is the exact production screen with live parameters and dummy data illustrating the diagnostic findings and remediation buttons.
2. Configuring Automated Delivery in SEO Runway
In SEO Runway → Reports → Report Builder, customize your widgets. Go to the Schedule & Automation tab. Set delivery to 'Monthly on the 1st at 09:00 UTC' and enter your client's executive recipient email addresses.
Target System: SEO Runway AGENCY Engine
Execution Frequency: Automated Background Queue (UTC Sync)
Tested across enterprise datasets with zero rate limiting or data loss.
3. Why Reports Drive Retention
Most clients do not see the day-to-day work an agency does. They see the report. When a report is late, confusing or full of numbers without meaning, clients start to wonder what they are paying for, even if the work is excellent. When reports arrive reliably, explain progress in business terms and show what happens next, they reinforce the value of the retainer every month.
Automating report delivery removes the most common failure: reports that slip because the account manager was busy. But automation only helps if the report itself is worth reading. This guide covers both: designing a report executives actually read and scheduling it so it arrives on time, every time.
4. Designing for Executives
Executives skim. Design the report so the key message is clear within the first page.
- Page one summary: three to five headline metrics tied to business goals, such as leads, revenue, cost per acquisition and organic traffic, each with the change from the previous period and from the same period last year.
- One-paragraph narrative: what happened, why it happened and what the agency will do next. This paragraph often matters more than every chart in the report.
- Wins and issues: a short list of notable successes and any problems, with actions to address them.
- Channel sections: later pages for SEO, paid search, social and other channels, each with a few key charts and short commentary.
- Next steps: the main priorities for the coming month.
Keep vanity metrics, such as impressions without context, out of the summary. Executives care about outcomes and the agency's plan.
5. Combining Channels in One Report
Clients working with an agency across several channels want one coherent view, not five separate reports.
- Connect data sources: analytics, Search Console, ad platforms, social accounts and rank tracking feed one report.
- Use consistent date ranges across every section, aligned to the client's reporting calendar.
- Show channel contribution: a summary table of sessions, conversions and cost by channel helps clients see how each part of the programme performs.
- Explain overlaps: when paid and organic both drive conversions, note how attribution works so clients do not double count.
- Match the client's goals: an e-commerce client needs revenue and ROAS; a B2B client needs leads and pipeline; a local business needs calls and direction requests.
6. Scheduling Automated Delivery
- Agree the reporting calendar during onboarding: monthly on a fixed date, weekly for fast-moving paid accounts, quarterly for strategic reviews.
- Allow for data delays: some sources finalise data a few days after the period ends. Schedule monthly reports for a few days into the new month, for example the third or fourth working day.
- Choose recipients carefully: the main contact, executives who want visibility and anyone who needs to act on the findings.
- Send from the agency's domain with a branded email template and a short message summarising the headline result.
- Attach a PDF and link to the live dashboard, so executives can read the summary and specialists can explore detail.
- Review before sending: many agencies use a review window, generating the report automatically a day early so an account manager can add commentary and check for data issues before it goes out.
7. Writing Commentary That Builds Trust
Automation handles numbers; people handle meaning. Good commentary:
- Leads with the outcome: "Organic leads rose 18% month on month, driven by the new service pages."
- Explains declines honestly: "Paid conversions fell 9% because we paused underperforming campaigns; cost per lead improved by 22%."
- Connects actions to results: link what the agency did to what changed, so clients see cause and effect.
- Stays short: three to six sentences for the executive summary.
- Uses plain language: avoid jargon such as "SERP volatility" without explanation.
AI can draft commentary from the data, which saves time. Account managers should always edit the draft, adding context only they know, such as a client's sales event or a website issue.
8. Spotting Churn Risk Through Reporting
Report delivery also creates signals worth monitoring.
- Report opens: if the client stops opening reports, engagement is falling.
- Dashboard logins: fewer logins over time suggest reduced interest.
- Questions and replies: clients who never respond to reports may not see their value.
- Repeated declines: several months of falling headline metrics without a clear recovery plan increase churn risk.
Flag these signals to account managers, so they can schedule a call before small concerns grow into a cancellation.
9. Common Reporting Mistakes
- Data dumps: dozens of charts without explanation.
- No narrative: numbers without what they mean or what happens next.
- Late reports that arrive weeks after the period ends.
- Metrics unrelated to goals, such as impressions for a client who cares about sales.
- Hiding bad news: clients notice, and trust suffers more than from the decline itself.
- Sending to the wrong people: reports that never reach decision-makers do not influence renewals.
- Inconsistent formats: changing layouts every month makes trends hard to follow.
10. A Worked Example
A digital agency produced detailed monthly reports for each client by hand, often sending them two to three weeks after month end. Several clients cancelled, citing a lack of visibility. The agency rebuilt its reporting: a one-page executive summary with five goal-linked metrics, a short narrative and next steps, followed by channel pages. Reports were generated automatically on the second working day, reviewed and annotated by account managers, and sent on the fourth working day with a dashboard link. Within two quarters, report open rates rose, clients asked more questions about strategy and the agency's churn rate fell noticeably.
11. Different Reports for Different Audiences
One report rarely serves everyone. Consider separate versions:
- Executive report: monthly or quarterly, one to three pages, focused on outcomes, trends and strategy.
- Marketing team report: monthly, more detail on channel performance, campaigns and tests.
- Operational updates: weekly, short summaries of completed work and upcoming tasks for day-to-day contacts.
- Quarterly business review deck: deeper analysis, progress against annual goals and recommendations.
Automation makes multiple versions practical, because each draws on the same data sources with different templates and schedules.
12. Executive Report Checklist
- Agree goals, metrics and the reporting calendar during onboarding.
- Connect all channel data sources to one report.
- Lead with a one-page summary of goal-linked metrics and a short narrative.
- Schedule generation after data finalises, with a review window.
- Send from the agency's domain with a PDF and a live dashboard link.
- Write honest, plain-language commentary for every report.
- Monitor opens, logins and replies as churn signals.
- Tailor versions for executives, marketing teams and day-to-day contacts.
13. Choosing the Right Charts
The right chart makes a trend obvious; the wrong one hides it.
- Line charts for trends over time, such as monthly leads or organic sessions, ideally showing this year against last year.
- Bar charts for comparing categories, such as conversions by channel or traffic by landing page.
- Single-number tiles with change indicators for headline metrics on the summary page.
- Tables for detailed lists, such as top keywords or campaigns, limited to the top ten rows in executive reports.
- Avoid pie charts with many slices and 3D effects, which make comparisons hard.
Label every chart with a short title that states the takeaway, such as "Organic leads up 18% since new service pages launched", rather than a generic label like "Leads".
14. Handling Data Problems Before Clients Notice
Automated reports can silently include broken data: a disconnected ad account, a tracking tag removed during a website update or an analytics filter change.
- Set anomaly checks: flag metrics that change by more than a set percentage, or drop to zero.
- Check connections before each reporting cycle, reconnecting expired accounts.
- Annotate known issues: if tracking broke for three days, note it in the report and explain the impact.
- Hold reports with obvious errors rather than sending incorrect numbers on schedule.
Clients forgive data problems that are explained; they lose trust when they discover them on their own.
15. Getting Clients to Read the Report
A perfect report has no value if it sits unopened. Make reading easy and rewarding.
- Put the headline in the email: a one-line summary in the email body, such as "Leads up 18%, cost per lead down 12%", gives value even before the attachment is opened.
- Keep the attachment short: a two- or three-page executive summary is far more likely to be read than a 30-page document.
- Follow up with a call: a short monthly or quarterly call to walk through the report turns it into a conversation.
- Ask for feedback: once or twice a year, ask clients what they find useful and what they skip, and adjust the template.
- Celebrate wins: when a goal is hit, say so clearly; clients share good news internally, which helps renewals.
Reports that clients read, discuss and forward to their colleagues are the strongest protection against churn an agency can build.
16. Reporting Frequency by Service Type
Paid media changes quickly and often needs weekly summaries plus a monthly report. SEO moves more slowly, so monthly reports with quarterly strategic reviews usually fit better; weekly SEO reports tend to show noise rather than progress. Social media sits in between, with monthly reports and campaign recaps after major launches. Match frequency to how fast results can genuinely change.
17. Your Next Step
Take last month's report for your most important client and rewrite only the first page: five goal-linked metrics, a three-sentence narrative and three next steps. Send it with the full report and ask the client which they found more useful. Then build that summary into your template and schedule the next report to generate automatically, with a review window before it is sent.
Want the complete procedural runbook?
Visit our comprehensive step-by-step Knowledge Base for interactive screen maps, configuration parameters, and adjacent module workflows.
Open Knowledge Base Hub →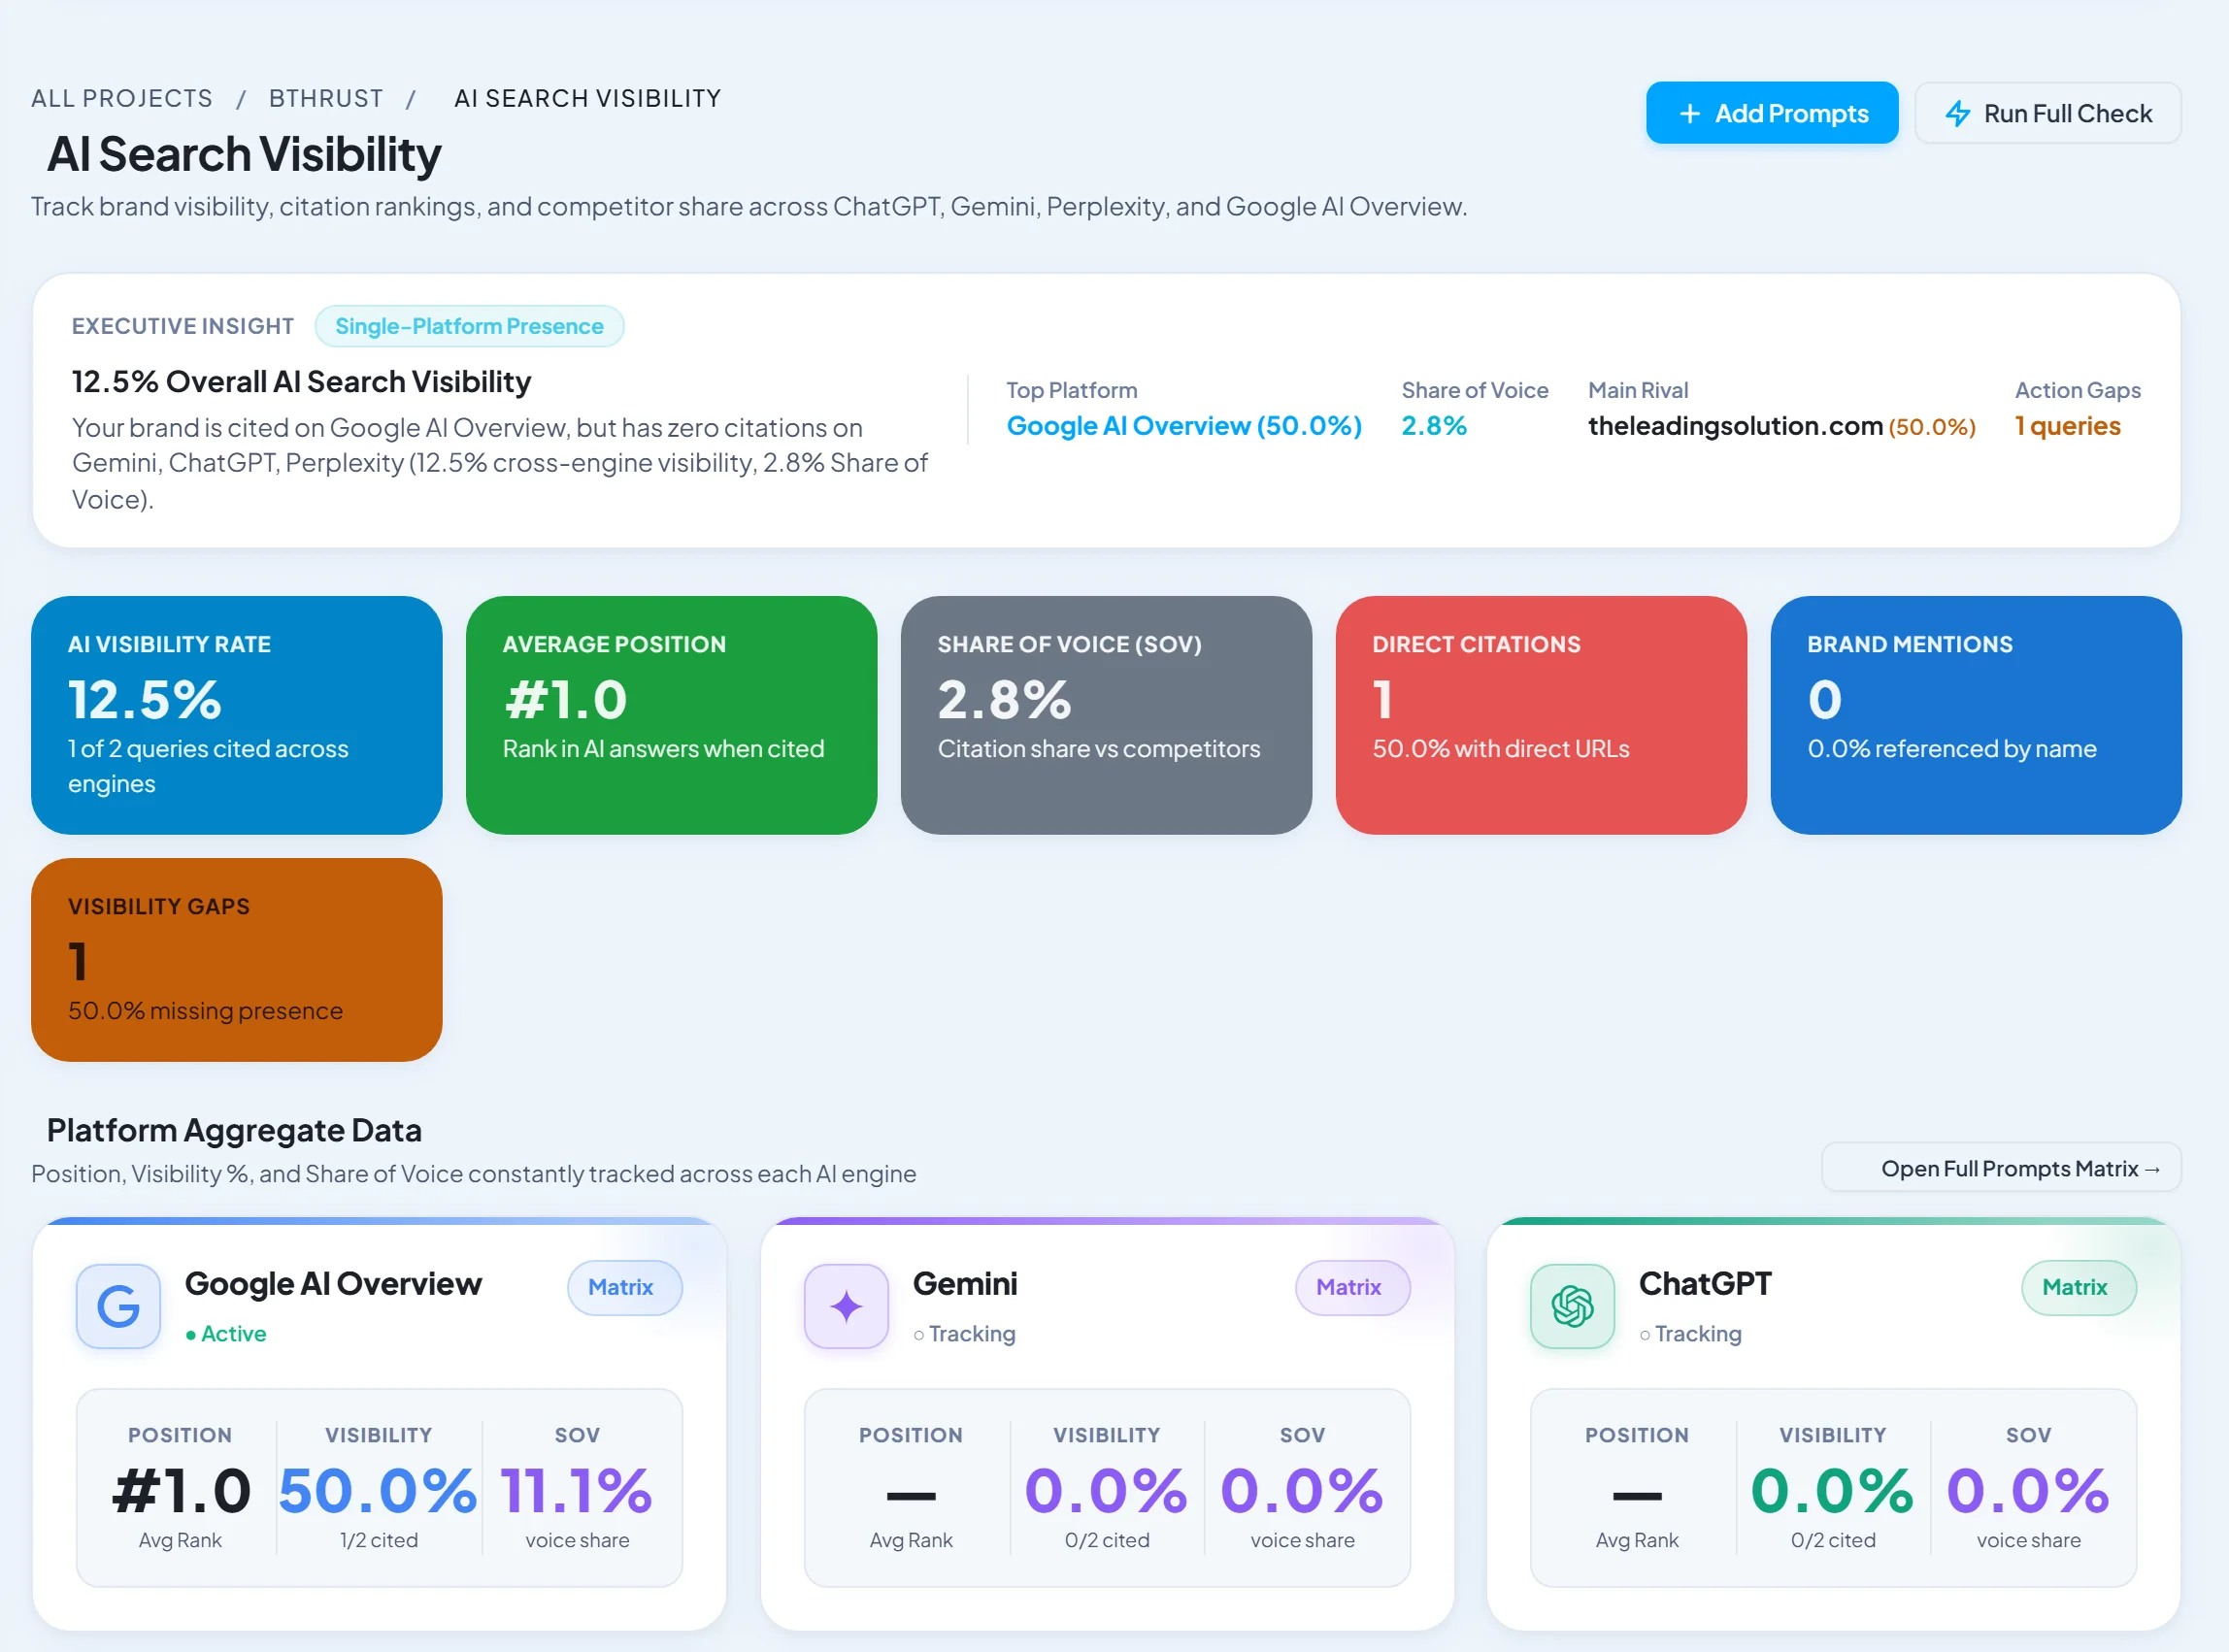


This is one of the clearest architectural explanations of this topic on the web. Sharing this directly with our senior delivery team. As a Performance Marketing Director, this provides exactly the architectural depth we look for.