

/projects//content/ & /projects//ai_search/ ).
1. The Information Density of Semantic Tables
In retrieval-augmented generation pipelines, token efficiency is paramount. A clean HTML table provides high information density: clear attributes in the first column, standardized metrics across subsequent columns. This enables the LLM reasoning layer to synthesize immediate comparisons without hallucinating values.
LIVE PLATFORM SCREEN & TELEMETRY
SEO Runway Content Studio & AI Search Citation Mining — Active Workspace
Below is the exact production screen with live parameters and dummy data illustrating the diagnostic findings and remediation buttons.
2. Authoring Guidelines in SEO Runway Content Studio
When writing comparison guides in SEO Runway → Content Studio, use the 'Insert Structured Table' component. The editor enforces standard <thead> and <tbody> formatting and automatically scores tabular entity coverage.
Target System: SEO Runway GEO Engine
Execution Frequency: Automated Background Queue (UTC Sync)
Tested across enterprise datasets with zero rate limiting or data loss.
3. Why Tables Work Well for AI Answers
Generative search engines answer many questions by comparing things: plans, products, specifications, prices, features, timelines. To do that, they need facts they can extract and line up reliably. Information scattered through long paragraphs ("our Pro plan, which costs a little more than Starter but includes priority support...") is harder to extract accurately than the same facts in a well-structured table. Tables also help human readers scan and compare, which is why they are common on the pages AI engines cite for comparison questions.
Structured tabular data helps in three ways:
- Extraction accuracy: a clearly labelled row and column makes it unambiguous which value belongs to which item.
- Completeness: a table forces you to state every attribute for every item, filling gaps engines would otherwise guess.
- Answer formatting: AI answers often present comparisons as lists or tables themselves, and well-structured source tables map naturally into them.
4. Designing Tables for Retrieval
- Use real HTML tables. Build tables with
<table>,<thead>,<th>and<td>, not images, CSS grids of divs or JavaScript-rendered widgets. Images of tables can't be read as data, and div grids lose their row and column relationships. - Give the table a caption. A
<caption>such as "Plan comparison: prices in USD per month, checked March 2026" tells readers and machines exactly what the table contains and when it was accurate. - Use clear header labels. Column headers should be explicit ("Monthly price (USD)", "Users included", "Free trial") rather than vague ("Info", "Details").
- One fact per cell. Avoid cramming several facts into one cell. "Yes, up to 5 users, extra $10/user" is better split into separate columns.
- Use consistent units and formats. Same currency, same billing period, same date format across every row.
- Put the item name in the first column and use
<th scope="row">for row headers, so each row's subject is explicit. - Keep tables focused. A table with 8 columns that answers one question is more useful than one with 30 columns covering everything.
5. Surrounding the Table with Context
A table on its own isn't enough. The best-performing pages pair it with:
- A one-sentence summary above the table giving the main takeaway ("For teams under 10 people, the Starter plan is the cheapest option with all core features").
- Short explanations below for important nuances the table can't show, such as annual discounts, usage limits or regional differences.
- A clear "last updated" date, especially for prices.
- Headings that match the question the table answers, such as "Pricing compared" or "Which plan includes API access?".
6. Adding Structured Data
HTML tables describe data visually and semantically; schema.org markup can add machine-readable meaning. Useful types include:
- Product with Offer (and
AggregateOffer) for pricing and availability. - ItemList for ranked or curated lists, such as "best tools" articles.
- Dataset for pages publishing original data, such as survey results or benchmarks.
- SoftwareApplication with
offersfor software plans.
Keep structured data consistent with the visible table. If the table says $49 and the schema says $39, both search engines and users lose trust. Generate both from the same data source where possible.
7. Types of Tables That Earn Citations
- Pricing and plan comparisons: prices, limits, included features, trial availability.
- Product or tool comparisons: key features, best-for use cases, platform support.
- Specifications: dimensions, compatibility, performance figures.
- Timelines and processes: steps, durations, responsible parties.
- Original data: survey results, benchmarks, statistics with methodology notes.
- Pros and cons summaries, which engines often reflect in "advantages and disadvantages" answers.
8. Keeping Tables Accurate
Out-of-date tables are worse than no tables, because engines may repeat wrong prices or features confidently. Store the facts behind important tables (prices, plan limits, specifications) in a single structured source, such as your CMS, a product database or a shared spreadsheet, and render the tables from it. Set review dates for competitor comparisons, since other companies' pricing changes without notice. When a value changes, update the caption date so readers and crawlers can see the information is current.
9. Testing Whether It Works
Pick a set of comparison and pricing prompts relevant to your tables and run them in ChatGPT search, Perplexity, Gemini and Google AI Overviews before and after you restructure the page. Record whether your page is cited and whether the answer reflects your table's values accurately. Combined with an AI visibility tracker running the same prompts on a schedule, this shows whether clearer data translates into more, and more accurate, citations.
10. Accessibility and Mobile Considerations
Tables built for machines should also work for people, including those using screen readers and small screens:
- Use
<th>withscope="col"andscope="row"so screen readers announce headers with each cell. - Wrap wide tables in a horizontally scrollable container on mobile instead of shrinking text until it's unreadable.
- Avoid merged cells (
rowspanandcolspan) in data tables where possible; they complicate both screen-reader navigation and machine extraction. - Don't rely on colour alone to show meaning (for example green for "included"). Use text such as "Yes" or "Included".
- Keep the table in the HTML on page load rather than loading it after interaction, such as inside a tab that fetches data on click.
11. Common Mistakes
- Publishing tables as images or PDFs.
- Using checkmark icons without text alternatives.
- Mixing billing periods or currencies in one column.
- Hiding the table behind tabs or accordions rendered only with JavaScript.
- Letting competitor data go stale for months.
- Tables with no caption, date or explanation of what the values mean.
12. Tabular Data Checklist
- Real HTML table with caption, header cells and row headers.
- One fact per cell, with consistent units and formats.
- Summary sentence above and key caveats below.
- Visible "last updated" date.
- Structured data consistent with the visible values.
- Data rendered from a single maintained source.
- Accessible on screen readers and mobile.
- Citations and answer accuracy tested on relevant prompts.
13. Before and After: Restructuring a Pricing Page
A typical "before" pricing page shows three plan cards, each with a price in large type and a bullet list of features, where each card lists different features in a different order. A reader, or an AI engine, has to compare three unaligned lists to work out which plan includes API access or how many users each allows. Some limits only appear in a tooltip.
The "after" version keeps the cards for visual appeal but adds a comparison table directly beneath them: one row per feature or limit, one column per plan, a caption with the currency, billing period and date, and plain text values ("Included", "Not included", "Up to 10"). A short paragraph above the table summarises who each plan is for. Tooltip content moves into a notes section below the table. Nothing is hidden behind interactions.
The result answers "Which plan includes X?" and "How much does it cost for Y users?" in a form that is easy for anyone to read and quote. It is also the form answer engines most often reflect when users ask those questions.
14. Tables for Comparison and "Best Of" Content
Listicles and comparison articles are among the most cited page types for commercial AI queries. Their tables work best when they include:
- A "best for" column summarising each option's ideal user in a few words. Answer engines frequently reflect these labels when users ask which tool suits them.
- Entry price with billing period, plus a free plan or trial column.
- Three to six key attributes that matter for the decision, rather than every feature.
- Consistent ordering that matches the order of detailed reviews below the table.
- A methodology note explaining how options were chosen and when data was checked.
If you include your own product in a comparison, disclose it and apply the same criteria to every option. Balanced tables are more credible to readers and more defensible as a source, and they avoid the obvious bias that makes one-sided comparisons less useful.
15. Turning Internal Data into Citable Tables
Many organisations hold data that would make excellent original tables: average delivery times by region, benchmark results, customer survey findings, usage statistics or cost breakdowns. Publishing a small, well-explained table of genuine first-party data gives answer engines something no competitor can supply. Include the sample size, date range and method beneath the table, and give the page a stable URL so others can cite it. Original data tables also tend to attract editorial links, which strengthen the page's authority in both classic and AI search.
16. A Quick Audit of Your Existing Tables
Most sites already have tables that could work harder. Spend an hour reviewing your ten most important commercial pages against five questions. Is the data in a real HTML table rather than an image or card layout? Does it have a caption and date? Are headers explicit and units consistent? Does every cell hold a single clear value? Is the information still accurate today? Pages that fail two or more of these are your first candidates for restructuring, and they are often quick wins, because the underlying information already exists and only needs presenting clearly.
Clear tables are one of the simplest, most durable improvements you can make for AI search. They help readers decide faster, help answer engines quote you accurately, and keep paying off as long as the data behind them stays current. Start with your pricing and comparison pages, measure citations for a month, then extend the approach to specifications, processes and original data across the rest of the site.
Each table you add or clean up is a small, permanent asset: easier for visitors to use today, and easier for every future search and answer engine to understand.
Want the complete procedural runbook?
Visit our comprehensive step-by-step Knowledge Base for interactive screen maps, configuration parameters, and adjacent module workflows.
Open Knowledge Base Hub →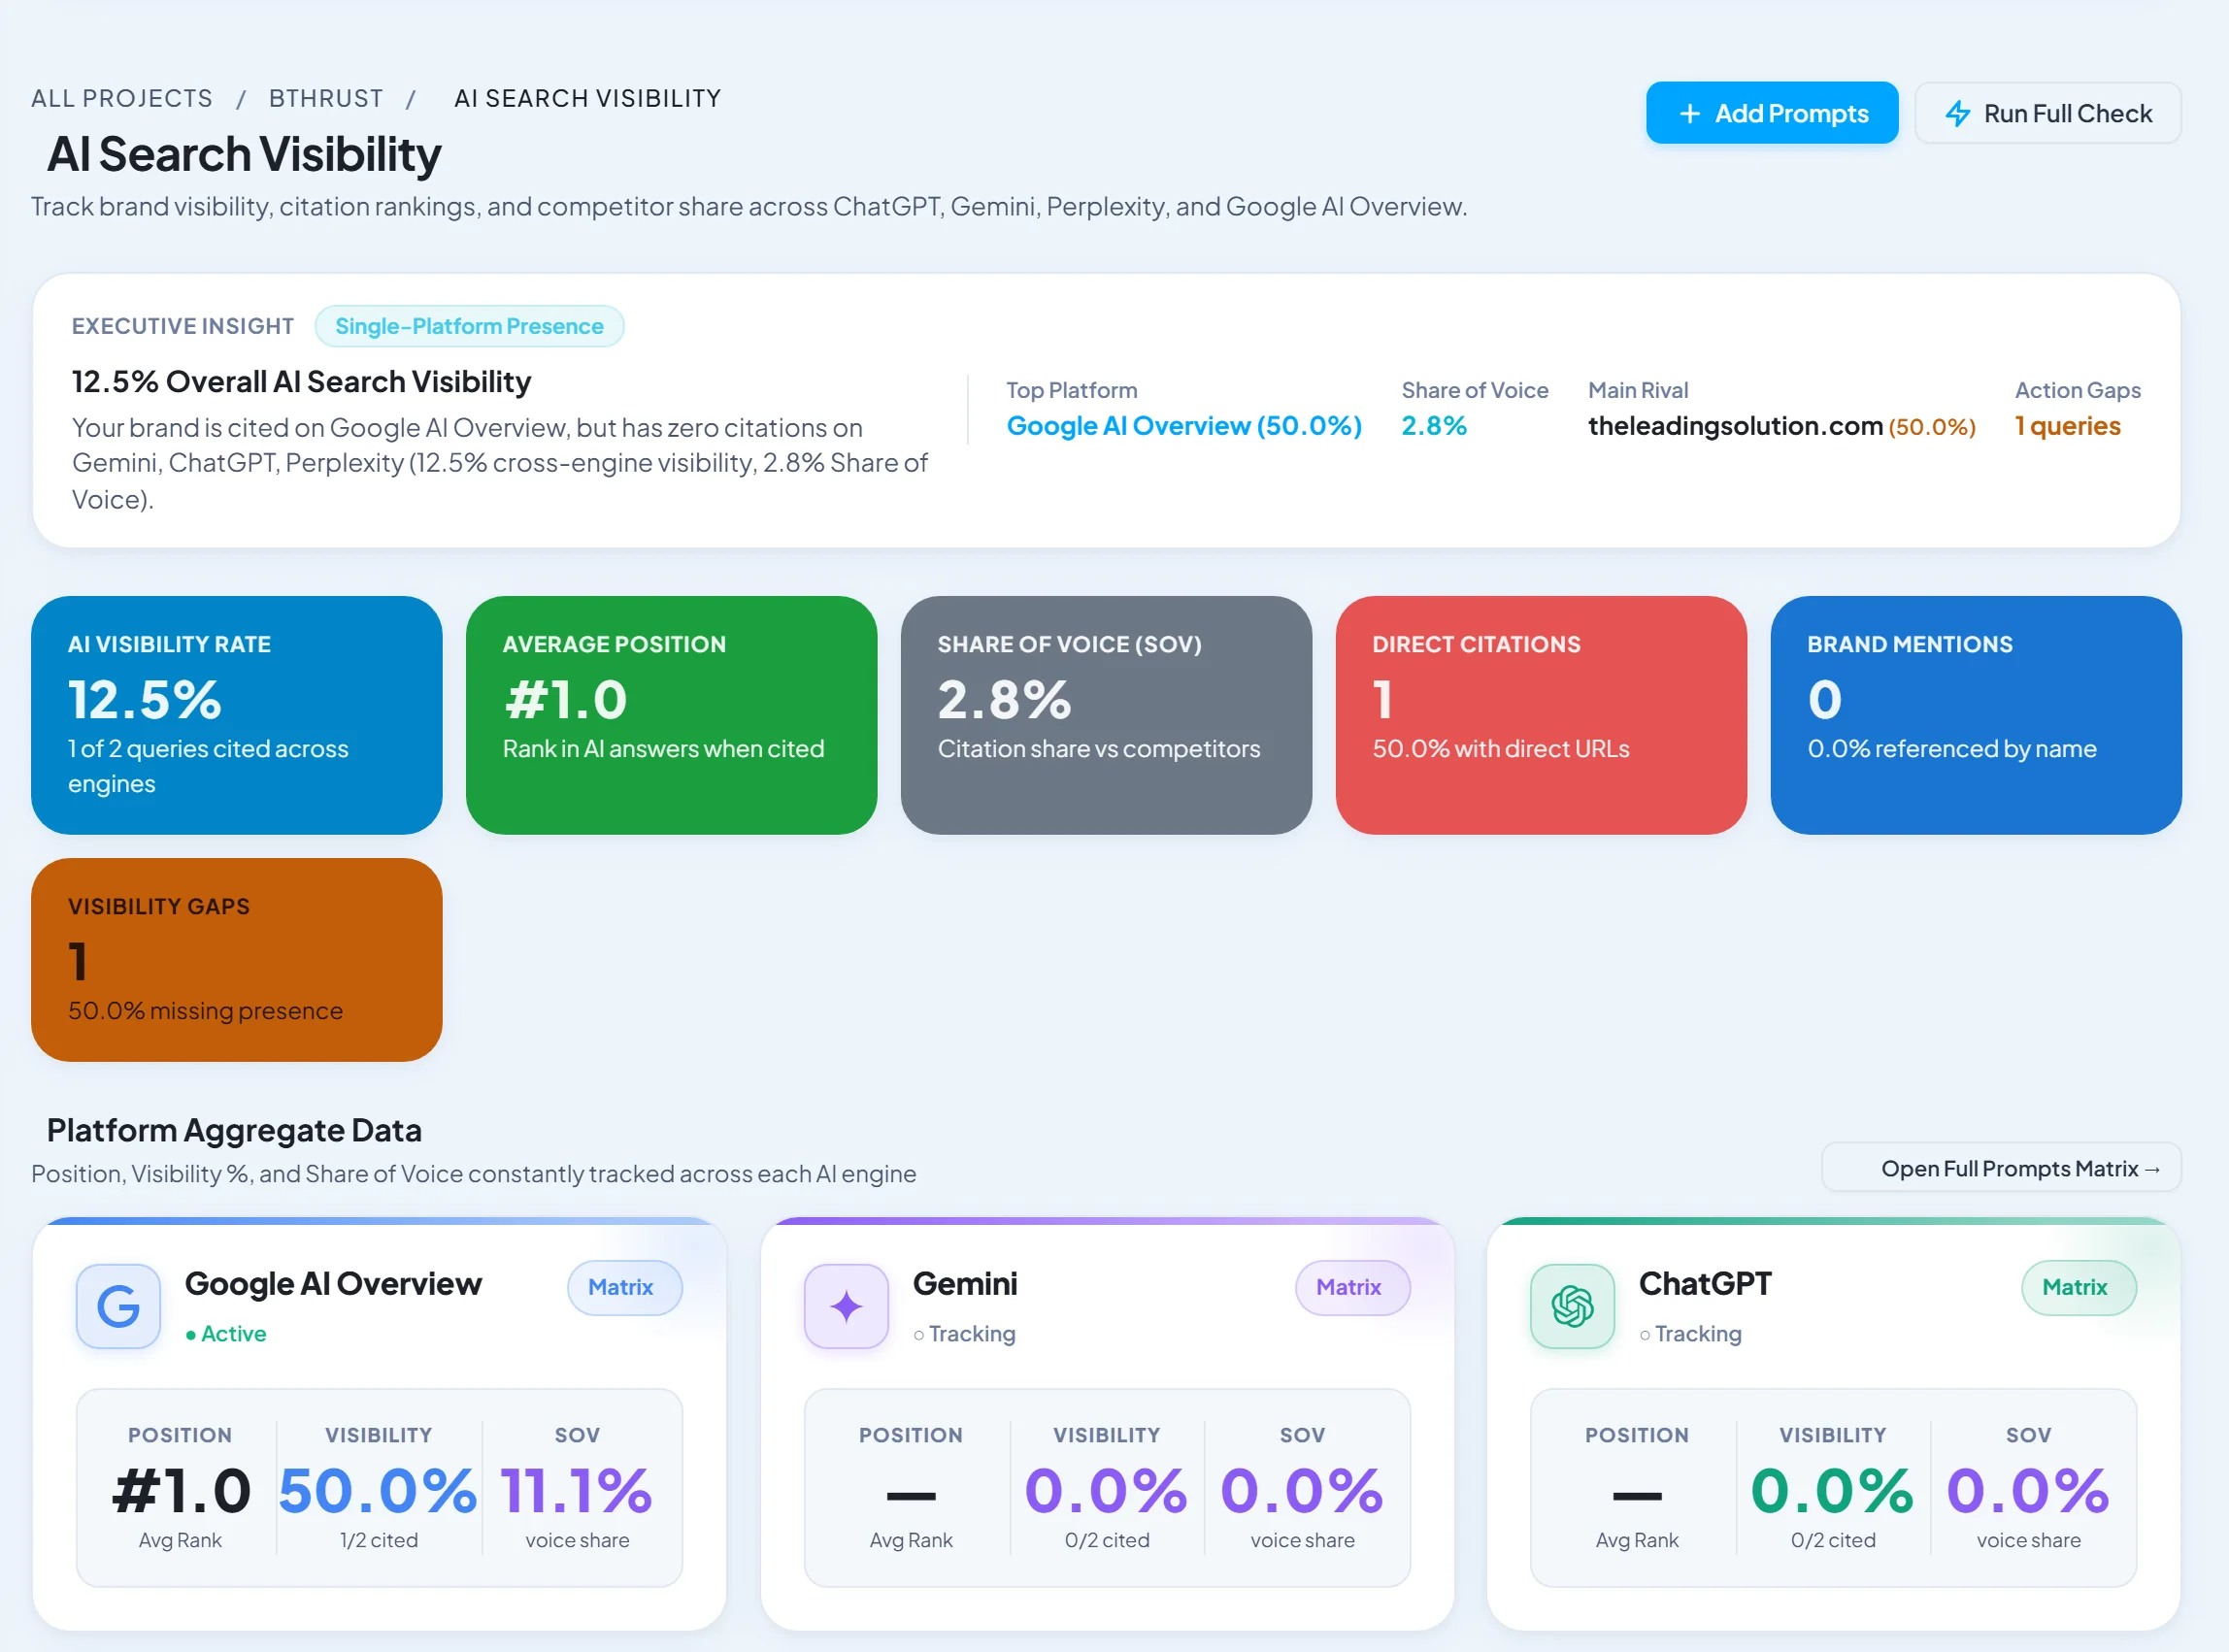


This is one of the clearest architectural explanations of this topic on the web. Sharing this directly with our senior delivery team. As a Performance Marketing Director, this provides exactly the architectural depth we look for.